


Innovation Report Card 2024
Grade
C
Rank
15/20
The alarm bells are ringing.
Canada’s poor innovation performance is at an all-time low, and the world is taking notice. The Organisation for Economic Co-operation and Development (OECD) predicts Canada will be the worst performing (advanced) member country over the next four decades as measured by real GDP per capita.
Canada’s inability to speed up innovation-based economic growth isn’t just a business risk. It’s also a prelude to reduced international leadership potential, less availability of quality jobs, and a subsequent decline in its citizens’ living standards. Failing to reverse this trend will put what we hold dear as Canadians at risk.
This report card is a wake-up call for policy-makers and business leaders. It paints a picture of a country that has lost its way on innovation. If we don’t change our path, all Canadians will suffer.
Updated: April 11, 2024
Key Findings
Canada has lost its way regarding innovation.
1.
Canada ranks 15th out of 20 peer countries, scoring a C grade on innovation performance. Of the 21 innovation indicators we examined, Canada scores below average on 14 of the indicators.
2.
The country lags in innovation activity and results, despite a strong higher education and entrepreneurial ecosystem.
3.
Low business research and development (R&D) spending leads to lower technology adoption and fewer commercialization opportunities.
4.
Business R&D spending has declined by 25 per cent over the past 20 years, with limited large anchor firms investing in innovation.
5.
Canada ranks low in patent activity, technology adoption, mobile app development, and high-tech exports, weakening its global competitiveness.
6.
The venture capital sector has improved, but Canadian start-ups struggle to scale compared with U.S. counterparts.
7.
Fear of failure among entrepreneurs remains high, second only to China, stifling risk-taking and scaling of businesses.
8.
Canada performs well in higher education R&D, STEM graduate production, and entrepreneurial capabilities.
Canada receives a C in overall innovation ranking
| Country | Capacity | Activity | Results | Overall ranking | |
|---|---|---|---|---|---|
| 1 | Korea | A+ | A+ | B | A+ |
| 2 | Switzerland | A | C | A+ | A |
| 3 | Singapore | B | B | A- | B |
| 4 | Sweden | A+ | C | C | B |
| 5 | Germany | B+ | C+ | C | B |
| 6 | Israel | C | A- | B- | B- |
| 7 | United States | B | B+ | C- | B- |
| 8 | Finland | A- | C- | D+ | B- |
| 9 | Netherlands | B | C+ | C- | B- |
| 10 | Denmark | A | D | C- | B- |
| 11 | Ireland | C+ | C- | B- | C+ |
| 12 | Austria | A- | D | D+ | C |
| 13 | United Kingdom | B | C+ | D | C |
| 14 | Norway | A | D- | D- | C |
| 15 | Canada | B | C | D- | C |
| 16 | Australia | B | C- | D- | C- |
| 17 | France | B- | C- | D | C- |
| 18 | Japan | D | C | C- | D+ |
| 19 | China | D- | C- | C- | D |
| 20 | Italy | D | D- | D- | D- |
Source: Signal49 Research.
The 2024 Report Card
Building on the Innovation Report Cards of 2019 and 2021, Signal49 Research’s 2024 Innovation Report Card (IRC) is even more comprehensive in its ability to provide direction to decision-makers. This year’s IRC provides an evidence-based assessment of our nation’s performance across 21 indicators of innovation performance compared with 19 of our peer nations.
The results are sobering.
Each of the 21 innovation indicators offers an opportunity for action. Although we recognize that innovation does not necessarily interact in linear ways, there is a logical order to analyze indicators: innovation capacity, activity, and results.
The three pillars of innovation—A continuum from capacity to activity to results
Capacity
Pillar 1—Innovation capacity
Capacity examines the resources required to provide a strong foundation for human capital development, knowledge diffusion, and entrepreneurship. This includes a measure of the productivity of the scientific community, knowledge intensity of the economy, and workers’ and entrepreneurs’ ability to adapt to technological change.

Activity
Pillar 2—Innovation activity
The main economic actors that innovate in the economy are individuals and firms. Innovation activity includes investments made by businesses and other investors to further develop ideas and implement productivity-enhancing technologies, as well as early steps taken by entrepreneurs to start new ventures. Going beyond analyzing the business investment in R&D, we provide a greater understanding of the role of business investment in the innovation process.
Results
Pillar 3—Innovation results
Application of new knowledge to produce a new product, service, or a new way of producing something more efficiently manifests itself in different parts of the economy. Accordingly, indicators under this pillar emphasize not only inputs to the innovation process such as patents, but also measures of productivity, and global market competition.
Sources: Innovation, Science and Economic Development Canada; The Conference Board of Canada.
As a nation, as business leaders, as educators, as researchers, and as citizens, it is critical that the innovation decline is reversed. We are not without hope. But we may be running out of time as our competitors surge ahead.


Assessing Canada’s innovation
A growing fear of failure is preventing us from achieving greatness (capacity) D
We have a culture of innovation problem: Canadians are afraid to fail, therefore they don’t act on their bold ideas. A high proportion of adults believe there are startup opportunities, and they have necessary entrepreneurial skills, but nearly half of these individuals are deterred from taking action by a fear of failure.
Canada’s fear of failure rate has increased in recent years
(percentage of 18–64 population who see good opportunities but would not start a business for fear it might fail)
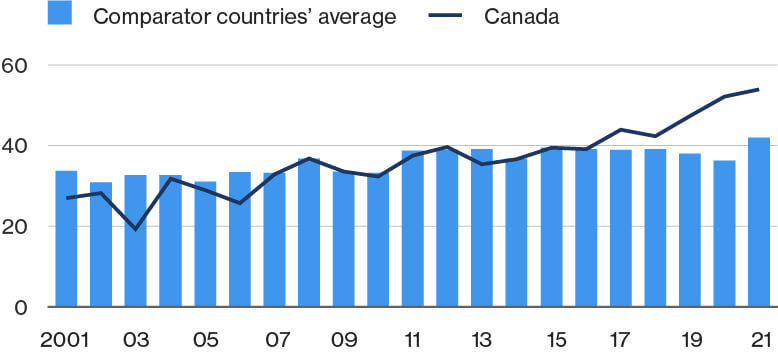
Note: This is a percentage of those seeing good opportunities, and not the total adult population.
Sources: Global Entrepreneurship Monitor; Signal49 Research.
Government R&D is stagnating in the face of competing priorities (capacity) D
Canada is not investing as much in R&D as peer countries. While Canada’s investments were once near the average of its peers, they have precipitously dropped since the 1980s.
Business R&D is not filling the gap (activity) D
For most of Canada’s peer nations, as public R&D declines, business R&D increases to make up for the gap. However, this is not the case for Canada. Canadian business R&D has been declining for nearly 20 years, falling by a third over this period.
Canada’s largest companies underperform globally on R&D spending (activity) D
Homing in on our country’s largest global companies does not make the situation look brighter. Canada is third-last among global corporate R&D investors. While Canada’s largest companies’ R&D spending has stagnated for the last decade, average spending for companies in peer nations is rising.
Canada’s position has worsened in the last 20 years in business enterprise expenditure on R&D
(business enterprise expenditure on R&D as a percentage of GDP)
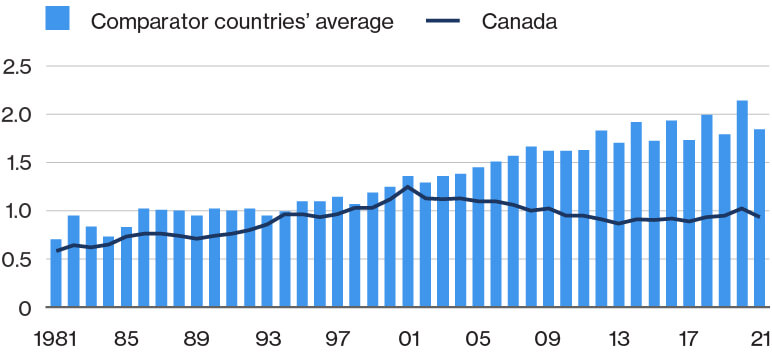
Sources: Organisation for Economic Co-operation and Development; Signal49 Research.
Canada deploys robots less than almost every other peer nation (activity) D
Canadian manufacturing companies are not adopting automation and advanced technologies at the same degree as their counterparts in peer nations. With other countries prioritizing efficiency and cost reduction at a greater rate, our domestically manufactured products may struggle to compete globally.
A declining manufacturing base has collapsed our competitive industrial performance (results) D
Canada’s Competitive Industrial Performance (CIP) ranked above average in the 1990s and the 2000s, but our position has worsened for over 20 years straight. This is an indicator where Canada has fallen from a C to a D since the previous Report Card. CIP is an index of the ability to produce, and export, manufactured goods competitively. Technological capability, industrial diversity, and export sophistication can be inferred by this index.
High-tech exports have not yet fulfilled their potential (results) D
Historically, Canada is below average on exporting domestically manufactured high-tech goods. And, while the average of its peers has risen over time, the country has largely stagnated.
Canada has performed consistently below average in
recent years in high-tech exports
(high-technology exports, percentage of manufactured exports)
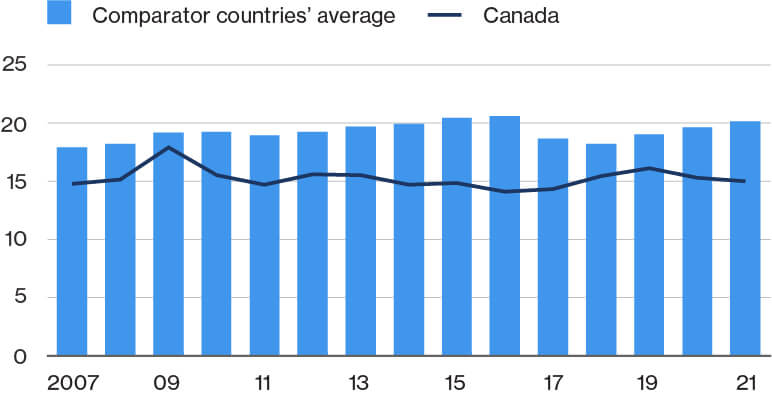
Sources: World Bank; Signal49 Research.
Developers wanted: Canada’s mobile app ecosystem needs to create more unicorns (results) D
Given the increased reliance of products and services on our phones, a thriving ecosystem for mobile app development indicates a conducive environment for startups and entrepreneurs. However, here too, Canada performs below average and near the bottom of the pack. Israel and Singapore lead on mobile apps, followed by the Nordic countries of Finland and Sweden.
Canada receives a D in mobile app creation
(the number of global downloads of mobile apps, by origin of the headquarters of the developer/firm, scaled by PPP$ GDP, billions)
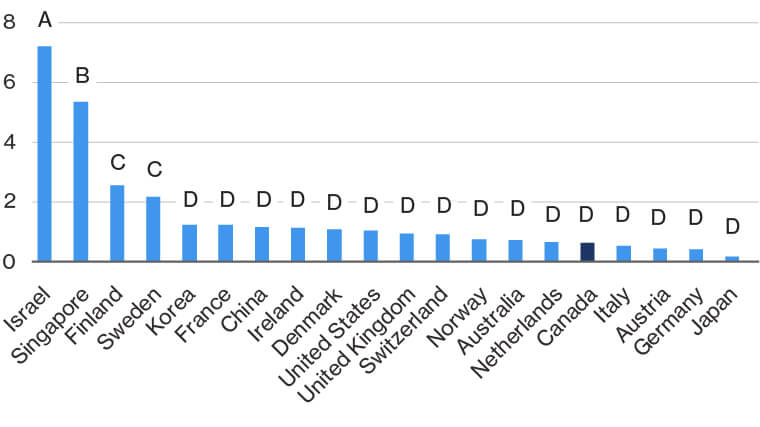
Sources: World Intellectual Property Organization; Signal49 Research.
Reversing our poor patent performance is imperative (results) D
Canada’s patent performance ranks near the very bottom, just above Italy and China. While the average performance of peer nations continuously increases, ours is worsening.
Trademark registrations are trending up, but have significant room to grow (results) D
Canada has seen some growth since 2019 despite being at the very bottom of this indicator for decades. However, Canada is still far-away from its peer average.
Growing industrial design registrations offer a new area for focus (results) D
Canada consistently ranks below average in industrial design registrations—the measure of firms’ and individuals’ ability to invent and seek protection for their R&D outputs. However, we have seen an increase in industrial design registrations at a similar time scale to trademark registrations.
Canada consistently ranks below the average and its
position has worsened in recent years
(number of patent cooperation treaty publications per million population)
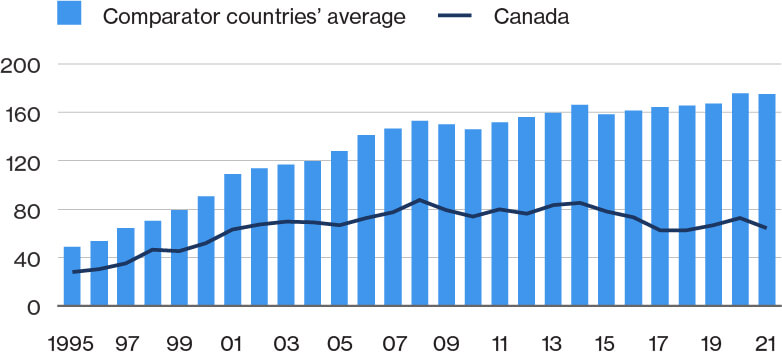
Sources: World Intellectual Property Organization; Signal49 Research.
Canada is slightly below its peers on MFP growth (results) D
Canada’s low labour productivity (GDP/hour worked) is well documented. The less reported metric of MFP measures the innovative ways and overall efficiency in which businesses combine labour and equipment in the production process. This measure of productivity is important because the more efficient our economy and society, the more we can raise living standards and reduce the environmental impacts of economic activity.
Canada usually ranks close to or below average in multifactor
productivity growth rate
(annual multifactor productivity growth rate, 5-year moving average)
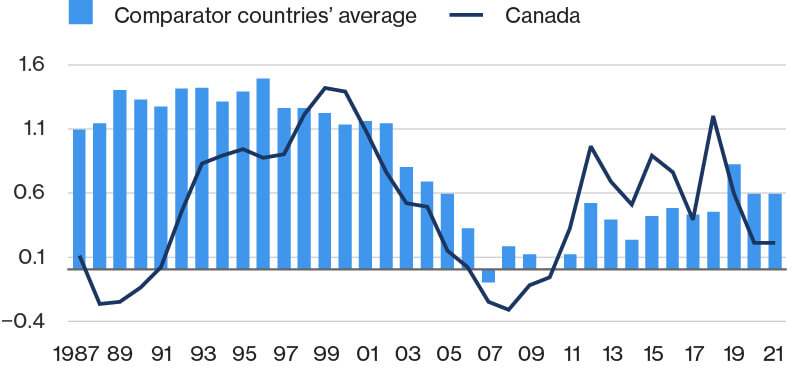
Sources: Organisation for Economic Co-operation and Development; Signal49 Research.
Full text and all charts available in the PDF.
Scientific article output is near average but has waned over time (capacity) C
Scientific articles are important to innovation, as they indicate scientific knowledge creation. Canada was once above average in knowledge creation, but has fallen compared with its peers over the last decade.
We have a sufficient researcher base to build innovations (capacity) B
The number of research personnel across government, academia, and industry are about the average of our country’s peer nations. Canada has recovered on this metric after performing poorly for the last decade. While this metric could be further improved, it shows that Canada has a sufficient base from which to create and improve knowledge, as well as form the talent base for R&D.
Canada’s historically above-average position has started to erode in recent years
(number of scientific articles per million population)
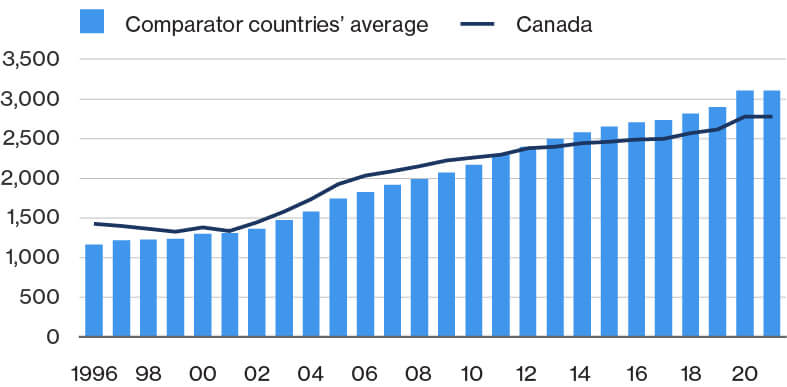
Sources: U.S. National Science Foundation; Signal49 Research.
Over 90 per cent of all Canadians use the Internet (capacity) A
How extensively a population uses Internet services is an important determinant of the diffusion of information, ideas, people’s ability to collaborate, and to be part of the digital economy. Despite our high levels of Internet use, we are one of the most expensive countries globally for Internet and mobile costs. There are alternative models to the geographic based competition of our current telecom regime. For example, an independent tower model would increase service-based competition, and thus, lower costs.
Canada always had above-average position in ICT use, but its position is slipping in recent years
(percentage of individuals using the internet)
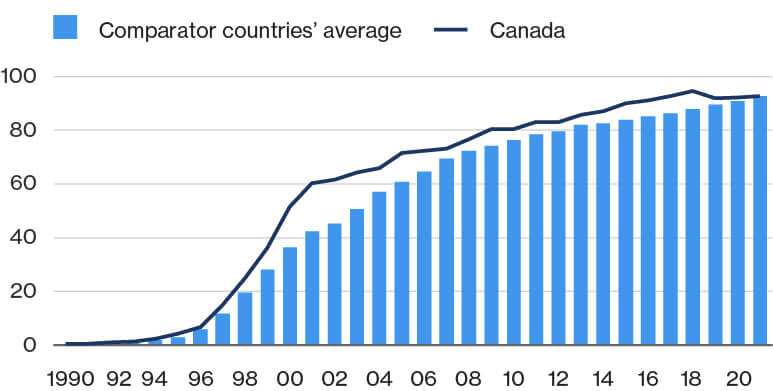
Sources: International Telecommunications Union; Signal49 Research.
VC Investment looks strong in Canada, but has to compete with the United States (activity) C
Venture capital, as a percentage of GDP, has experienced significant growth in recent years with 2021 being a bumper year. Accounting for the size of economies, Canada ranks third behind Israel and the United States which have 3.6 and 2.3 times more financing. Although the venture capital levels are healthier in Canada than in Europe, Canadian firms face a relative disadvantage. This is due to their close proximity to competitors and greater access to capital in the United States, which can compel Canadian firms to move south of the border.
Canada mostly ranks higher than average in venture capital investment
(venture capital investment as a percentage of GDP)
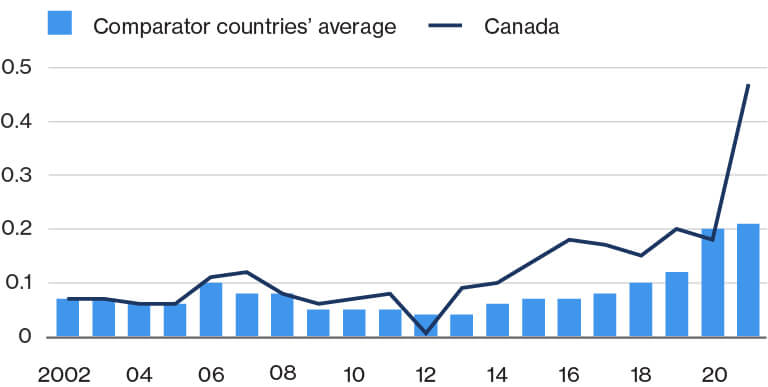
Sources: Organisation for Economic Co-operation and Development; Signal49 Research.
Full text and all charts available in the PDF.
Canadian higher education R&D is consistently strong (capacity) B
While business and government R&D levels are troubling, our higher education R&D is at a stable, above average level compared with peers. Higher education institutions conduct research across an array of fields compared with the greater specificity of business R&D. This makes Canada’s innovation economy heavily reliant on the higher education sector for the generation of new ideas and early-stage technologies. The poor transfer of new ideas and talent into innovation-based growth is a known paradox in Canada.
Canada sufficiently produces STEM graduates, but should keep an eye on retention (capacity) B
A talented future workforce is key to a successful innovation system. Canada ranks highly in educating its population, receiving a B in producing highly qualified personal. Although we are relatively strong in this area, a concern is that these graduates do not remain in Canada, drawn by higher wages or greater opportunities outside of the country. Creating a thriving innovation ecosystem of companies for STEM graduates to stay in Canada, and attracting highly qualified personal from abroad, should be a priority to ensure this ranking translates into domestic innovation-based economic growth.
Canada has consistently above-average spending on higher
education expenditure on R&D
(higher education expenditure on R&D as a percentage of GDP)
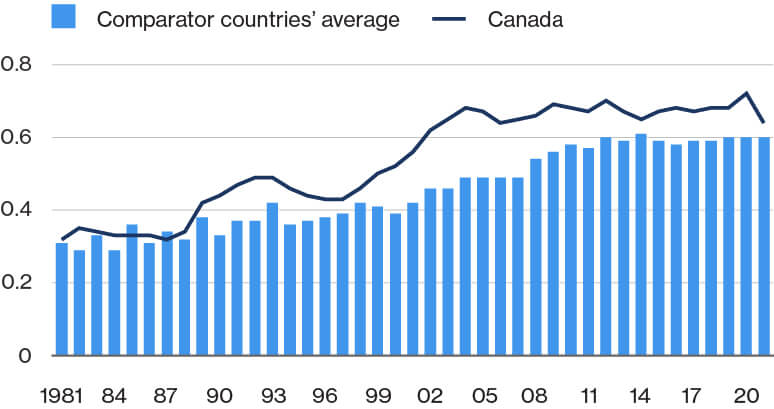
Sources: Organisation for Economic Co-operation and Development; Signal49 Research.
Canadians believe there are many good entrepreneurial opportunities (capacity) A
Entrepreneurialism is where Canada ranks strongest compared to its peers. Many Canadians believe they can identify gaps, unmet needs, emerging trends, or areas for improvement in the market or society.
Moreover, we strongly believe we have the skills to start a business (capacity) A
Canadians also believe in their ability to successfully undertake entrepreneurial endeavors. We have a strong culture of individual achievement and history of entrepreneurial migrants. Only Americans have more confidence than we do.
In fact, we excel at early-stage entrepreneurship (capacity) A
Canada has more individuals than any other peer nation who are either emerging entrepreneurs or owner-managers of new businesses. We have ranked well above average on this metric for the last decade.
Canada aways ranks at or above the average in entrepreneurial opportunities
(percentage of 18–64 population who see good opportunities to start a firm in the area where they live)
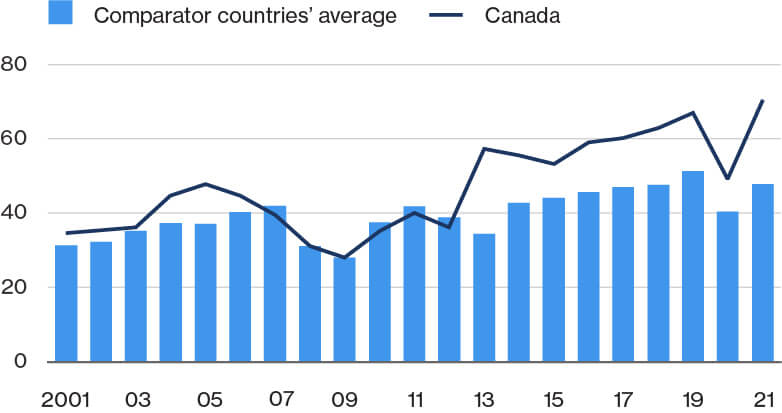
Sources: Global Entrepreneurship Monitor; Signal49 Research.
Full text and all charts available in the PDF.

Recommendations to improve innovation performance
The challenge we face calls for bold leadership that not only champions a fresh cultural outlook and policy narrative around innovation in Canada but supports an ecosystem for innovators to thrive and take risks.
To create the conditions to turn the corner, there are at least seven pivotal areas of opportunity from the results of the Innovation Report Card:
1.
Improve productivity by adopting new technologies.
2.
Make intellectual property and research and development the key drivers of commercial success by improving funding and programs.
3.
Expand the venture capital landscape to provide the financial backbone for startups and innovative projects.
4.
Support advanced manufacturing in Canada to rejuvenate our manufacturing sector.
5.
Inject a competitive spirit within the business ecosystem.
6.
Encourage new businesses by lowering risk and providing deep support for innovators.
7.
Reinforce our strengths in higher education and research by fostering entrepreneurial opportunities.