

Resale Markets Tighter Than Ever in January
Metropolitan Resale Snapshot
- Canada’s existing housing markets remained red-hot in January. Even in a pandemic-era economy, buoyant demand is being fuelled by low interest rates, consumer desire for more living space, and companies’ work-from-home policies. Persistently high sales will require sustained economic recovery and additional listings, which are in short supply. Although worries about the end of mortgage forbearance by chartered banks seem to be dissipating, high consumer debt and a soft apartment market in some cities remain concerns.
- While sales rose in 14 of our 30 markets in January, they were up 5 per cent or more in only seven areas. Nonetheless, transactions were above their year-earlier levels in all markets. Listings shortages may be limiting sales. Listings were down month-to-month in 26 of our 30 markets, including 23 where the loss was at least 5 per cent. Listings were below year-earlier levels in 19 markets. Many markets are thus drum-tight; 26 of them are in sellers’ territory and prices rose at least 10 per cent year-over-year in 24 areas. This tightening looks set to continue as sales rose faster (or fell less) than listings in 28 of our 30 markets last month.
- Sales rose in Vancouver, Calgary, and Toronto during January, but eased in Montréal. All cities’ changes were modest. Sales hit a record high in Toronto, while Vancouver’s are its highest since its foreign buyers’ tax was levied in 2016. Calgary’s volumes are the highest since oil’s price collapsed, and Montréal’s remain elevated.
- Listings fell in each of Vancouver, Calgary, Toronto, and Montréal during January with big drops in the latter two cities. They remain above year-earlier levels in Vancouver and Toronto, but are down in Montréal. Calgary’s were little changed. The January sales-to-listings ratio indicated sellers’ conditions in all four cities.
- Prices rose in Vancouver, Calgary, Toronto, and Montréal last month. Calgary’s gain was especially large. Moreover, values have advanced in double-digit terms from year-earlier levels in all four cities.
Recent market performance
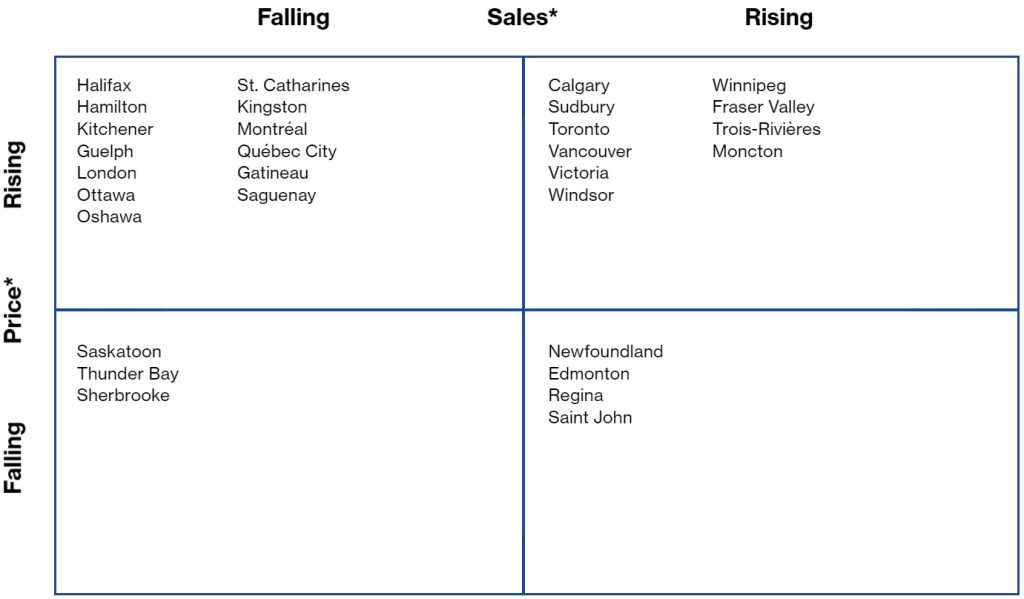
*Average month-to-month change during latest three months
Forecast of near-term price growth
(year-over-year)
7% +
Victoria, Vancouver, Fraser Valley, Winnipeg, Thunder Bay, Sudbury, Toronto, Oshawa, Hamilton, St. Catharines, Kitchener, Guelph, London, Windsor, Kingston, Ottawa, Gatineau, Montréal, Québec City, Sherbrooke, Trois-Rivières, Saguenay, Saint John, Moncton, Halifax
5–6.9%
Calgary, Edmonton
3–4.9%
None
0–2.9%
Regina, Saskatoon, Newfoundland
Falling
None

Many markets are drum-tight. This looks set to continue as sales rose faster than listings in most markets last month.
Resale indicators for January 2021
| Sales-to-new-listings ratio | ||||||||
| Market1 | Market classification | Sales (#)2 | Listings (#) | Level | Balanced market range3 |
Price ($) |
||
| Victoria | Sellers’ | 11,856 | 13,380 | 0.850 | 0.482–0.764 | 876,016 | ||
| m/m % | 8.6 | 1.2 | 10.8 | |||||
| y/y % | 65.2 | 12.9 | 20.3 | |||||
| Vancouver | Sellers’ | 47,868 | 66,732 | 0.768 | 0.434–0.716 | 1,104,167 | ||
| 1.1 | –2.6 | 2.0 | ||||||
| 71.7 | 27.1 | 11.1 | ||||||
| Fraser Valley4 | Sellers’ | 29,784 | 37,368 | 0.818 | 0.439–0.709 | 952,240 | ||
| 0.9 | –5.2 | 5.0 | ||||||
| 100.5 | 45.2 | 25.7 | ||||||
| Calgary | Sellers’ | 32,760 | 41,916 | 0.780 | 0.462–0.724 | 535,213 | ||
| 6.1 | –1.5 | 16.2 | ||||||
| 51.8 | –0.4 | 14.7 | ||||||
| Edmonton | Balanced | 28,740 | 40,668 | 0.690 | 0.449–0.710 | 384,306 | ||
| 17.7 | 4.8 | 3.4 | ||||||
| 66.0 | 10.6 | 5.2 | ||||||
| Regina | Balanced | 4,656 | 5,988 | 0.725 | 0.488–0.752 | 290,411 | ||
| 3.2 | –20.4 | –2.1 | ||||||
| 77.2 | –2.7 | –3.0 | ||||||
| Saskatoon | Balanced | 6,768 | 11,736 | 0.564 | 0.423–0.677 | 334,670 | ||
| 3.7 | 3.2 | 2.5 | ||||||
| 27.0 | 3.8 | 6.2 | ||||||
| Winnipeg | Sellers’ | 18,552 | 21,528 | 0.888 | 0.446–0.786 | 335,752 | ||
| 5.5 | –1.6 | 4.2 | ||||||
| 36.5 | –10.9 | 9.9 | ||||||
| Thunder Bay | Sellers’ | 2,388 | 2,616 | 0.929 | 0.495–0.754 | 274,162 | ||
| 7.6 | –8.4 | 3.3 | ||||||
| 7.6 | –5.6 | 15.8 | ||||||
| Sudbury | Sellers’ | 3,492 | 3,120 | 1.171 | 0.343–0.663 | 384,263 | ||
| 3.2 | –9.1 | 15.2 | ||||||
| 72.2 | 2.8 | 37.5 | ||||||
| Toronto | Sellers’ | 138,072 | 176,220 | 0.785 | 0.463–0.685 | 1,008,947 | ||
| 2.0 | –14.4 | 3.5 | ||||||
| 63.1 | 28.1 | 15.3 | ||||||
| Oshawa | Balanced | 13,584 | 18,720 | 0.740 | 0.477–0.748 | 872,822 | ||
| –8.4 | 5.9 | 11.9 | ||||||
| 19.2 | 8.9 | 34.9 | ||||||
| Hamilton | Sellers’ | 16,272 | 15,540 | 1.022 | 0.432–0.797 | 803,978 | ||
| –5.8 | –31.9 | 5.8 | ||||||
| 19.2 | –12.2 | 26.8 | ||||||
| St. Catharines | Sellers’ | 4,392 | 4,692 | 0.887 | 0.394–0.712 | 711,844 | ||
| –5.2 | –7.1 | 11.0 | ||||||
| 19.6 | –8.2 | 35.5 | ||||||
| Kitchener | Sellers’ | 10,152 | 10,416 | 0.895 | 0.481–0.761 | 695,364 | ||
| –5.4 | –16.6 | 7.1 | ||||||
| 29.8 | –2.3 | 24.5 | ||||||
| Guelph | Sellers’ | 3,756 | 4,080 | 0.927 | 0.505–0.835 | 762,712 | ||
| –5.2 | –24.4 | 2.7 | ||||||
| 13.0 | –4.2 | 31.2 | ||||||
| London | Sellers’ | 10,788 | 10,536 | 0.961 | 0.416–0.706 | 602,962 | ||
| –9.1 | –29.9 | 7.1 | ||||||
| 9.2 | –19.0 | 39.8 | ||||||
| Windsor | Sellers’ | 8,760 | 9,084 | 0.877 | 0.436–0.683 | 471,803 | ||
| –0.1 | –21.1 | 3.8 | ||||||
| 49.0 | –0.3 | 30.2 | ||||||
| Kingston | Sellers’ | 4,512 | 3,972 | 1.061 | 0.358–0.664 | 525,165 | ||
| –4.6 | –39.8 | 5.0 | ||||||
| 18.2 | –30.9 | 27.7 | ||||||
| Ottawa | Sellers’ | 22,140 | 23,556 | 0.943 | 0.409–0.707 | 607,386 | ||
| –2.5 | –15.5 | 8.9 | ||||||
| 26.7 | 17.3 | 26.1 | ||||||
| Gatineau | Sellers’ | 6,341 | 5,678 | 1.087 | 0.441–0.735 | 342,796 | ||
| –14.3 | –25.1 | 0.1 | ||||||
| 17.8 | –11.7 | 22.1 | ||||||
| Montréal | Sellers’ | 65,669 | 53,909 | 1.161 | 0.474–0.714 | 500,943 | ||
| –7.7 | –29.9 | 5.0 | ||||||
| 16.3 | –11.2 | 18.5 | ||||||
| Québec City | Sellers’ | 11,625 | 9,596 | 1.161 | 0.496–0.766 | 313,880 | ||
| –13.6 | –37.4 | 0.9 | ||||||
| 15.6 | –30.4 | 13.5 | ||||||
| Sherbrooke | Sellers’ | 3,086 | 2,555 | 1.178 | 0.444–0.751 | 317,356 | ||
| –0.2 | –15.4 | 1.7 | ||||||
| 35.4 | –1.8 | 15.7 | ||||||
| Trois-Rivières | Sellers’ | 1,770 | 1,249 | 1.461 | 0.472–0.795 | 216,476 | ||
| 6.1 | –31.8 | 0.9 | ||||||
| 8.6 | –31.2 | 17.3 | ||||||
| Saguenay | Sellers’ | 1,671 | 1,635 | 0.967 | 0.425–0.727 | 214,770 | ||
| –13.1 | –34.8 | –0.4 | ||||||
| 28.2 | –30.0 | 10.6 | ||||||
| Saint John | Sellers’ | 3,264 | 2,304 | 1.236 | 0.358–0.624 | 199,853 | ||
| –1.1 | –46.4 | 3.3 | ||||||
| 33.3 | ||||||||
The monthly Metro Resale Snapshot provides an overview of the existing home market for 30 areas and expectations for existing home price growth over the short term.
Any errors or omissions in fact or interpretation are the responsibility of Signal49 Research.
Disclaimer: Forecasts and research often involve numerous assumptions and data sources and are subject to inherent risks and uncertainties. This information is not intended as specific investment, accounting, legal, or tax advice.