

From Newcomers to Game Changers
A Scorecard for Immigrant Skill Utilization
Français | April 16, 2026
Key findings
- Overeducation is the most pronounced form of skill underutilization for both immigrants and Canadian-born citizens. However, immigrants face this type of skill mismatch at 1.8 times the rate seen for their Canadian-born counterparts.
- Involuntary part-time work is the second most pronounced type of skill underutilization in Canada, but immigrants fare worse again: They are 1.7 times more likely to experience this type of skill wastage than their Canadian-born counterparts.
- While temporary employment is not a common type of skill underutilization in Canada, groups experience it differently. Immigrants are more likely to work in term and contract jobs, while Canadian-born citizens are more likely to work in seasonal jobs.
- From 2022 to 2024, municipal progress in immigrant skill utilization was mixed. Most municipalities remain mid-range performers, with improvements in some and declines in others. Increasing immigrant skill utilization across Canada will require targeted interventions in lower-scoring municipalities.
Everyone loses when immigrant talent is underutilized
Canada has long prioritized selecting highly skilled and educated immigrants for permanent residency. Yet once they arrive, many find themselves unemployed or working below their qualification level. Immigrant skill underutilization contributes substantially to the $11 billion in economic losses that Canada will accrue by 2040, based on 2015– 2019 vacancy levels.1

To help tackle this problem, we developed the Immigrant Skill Utilization Scorecard in partnership with Canada’s Future Skills Centre. Our scorecard measures how well municipalities leverage the skills of permanent residents and naturalized citizens. Municipalities can use these results to track their progress over time.
We focus on three sectors where immigrant skill underutilization is pronounced in different ways: healthcare, construction, and hospitality. For in-depth analyses and targeted recommendations, see our healthcare, construction, and hospitality issue briefings. For how well Canada performs across all employment sectors, see below.

How we measured skill underutilization
Download our study methodology.
Skill underutilization takes two forms: mismatch and wastage.
People experience skill mismatch when they’re employed below their education level, such as a mechanical engineer working as a taxi driver. We measured this as the share of workers who were overeducated for their jobs.
People experience skill wastage when they can’t find employment, when they’re in precarious jobs, or when they work fewer hours than they want to. We measured this as the share of working-age people who were unemployed, in temporary jobs, or worked part time involuntarily.
Using Statistics Canada’s Labour Force Survey, we examined these problems separately for immigrants and Canadian-born citizens to see how each group fares in the labour market. Our analysis spanned from 2022 to 2024 and covered working-aged people (15–64 years) in 28 census subdivisions with survey data. For brevity, we refer to these as municipalities.
Interpreting our study results
There are several factors to consider when interpreting our study results:
- By design, most municipalities received B and C grades on our scorecard for 2022, our baseline year. Scorecard grades for 2023 and 2024 reflect changes from the 2022 average—specifically, how much better or worse each municipality performed during those years. If every municipality had performed better, they’d all have received A or B grades. If every municipality had performed worse, they’d all have received C or D grades. A mix of A, B, C and D grades would show a mix of better and worse performance. For more details, see our methodology.
- Grade changes don’t tell us why skill utilization improves or declines. Scorecard grades capture skill utilization across all immigrants in a municipality at a given time. This includes both long-term residents and recent arrivals. Changes in grades could reflect shifts in job matching among established immigrants, different utilization levels among new immigrants, or changes in who stays and who leaves.
- Policy changes occurred during our study period, but their impact is not yet known. For example, category-based selection was introduced to improve access to permanent residency for immigrants with experience in healthcare, STEM, trades, and transportation. Ontario also passed legislation prohibiting regulated professions from requiring Canadian work experience in licensing for more than 30 occupations. Both of these policy interventions may have helped immigrants find jobs that better matched their qualifications. However, without data that measures the policy impact, we cannot determine to what degree these interventions affected our scorecard grades.
- Cross-municipality commuting affects municipality performance, as the data were reported for each person’s place of residence, not their place of work. If someone lived in one municipality but worked in another, then their skill utilization score was attributed to their municipality of residence.
Most municipalities are mid-performers
In 2024, most municipalities achieved mid-range performance: 36 per cent of those with data received B grades and 54 per cent received C grades (Table 1). Only Vaughan (ON) achieved an A grade, while Regina (SK) and Moncton (NB) received D grades. In 2022 and 2023, there was roughly an even split between B and C grades across municipalities, with none receiving an A or D.
Progress from 2022 to 2024 was mixed. Among municipalities with data on at least three of the four types of skill utilization we examined, performance improved for three, worsened for five, and the rest remained stable (Chart 1).
B and C grades were expected in 2022 due to our methodology. The focus of this scorecard is on changes over time: Given the baseline grades we assigned for 2022, which municipalities received different grades in 2023 or 2024? We found that by 2024, improvements were only modest. Moving municipalities from B and C grades toward higher performance will require targeted interventions.
Table 1
Immigrant skill utilization scorecard grades
| Province | Municipality | 2022 | 2023 | 2024 |
|---|---|---|---|---|
| British Columbia | Abbotsford | No data | No data | B* |
| British Columbia | Burnaby | B* | C | B* |
| British Columbia | Surrey | B* | B | B |
| British Columbia | Vancouver | B | C | B |
| Alberta | Calgary | C | C | C |
| Alberta | Edmonton | C | C | C |
| Saskatchewan | Regina | C* | C | D |
| Saskatchewan | Saskatoon | C | B | C |
| Manitoba | Winnipeg | B | B | B |
| Ontario | Brampton | B | B* | C |
| Ontario | Hamilton | B* | C* | C |
| Ontario | Kitchener | B* | C* | B* |
| Ontario | London | C* | C* | C |
| Ontario | Markham | C | B | B* |
| Ontario | Mississauga | C | B | C |
| Ontario | Ottawa | C | B | B |
| Ontario | Toronto | C | C | C |
| Ontario | Vaughan | B* | B* | A* |
| Quebec | Gatineau | B* | B* | B* |
| Quebec | Laval | B* | B* | B* |
| Quebec | Longueuil | B* | C* | C* |
| Quebec | Montréal | C | B | C |
| Quebec | Quebec City | No data | B* | C* |
| Nova Scotia | Halifax | B | C* | C |
| Prince Edward Island | Charlottetown | C* | C* | C* |
| New Brunswick | Moncton | No data | C* | D* |
| New Brunswick | Saint John | No data | No data | C* |
| Newfoundland and Labrador | St. John’s | No data | No data | C* |
Note: Grades that are based on three indicators are marked with an asterisk (*). All others are based on four indicators. See our methodology for more information.
Sources: Statistics Canada; Signal49 Research.
Chart 1
From 2022 to 2024, progress was mixed and declines were nearly as common as gains
(number of municipalities, change from 2022 to 2024)
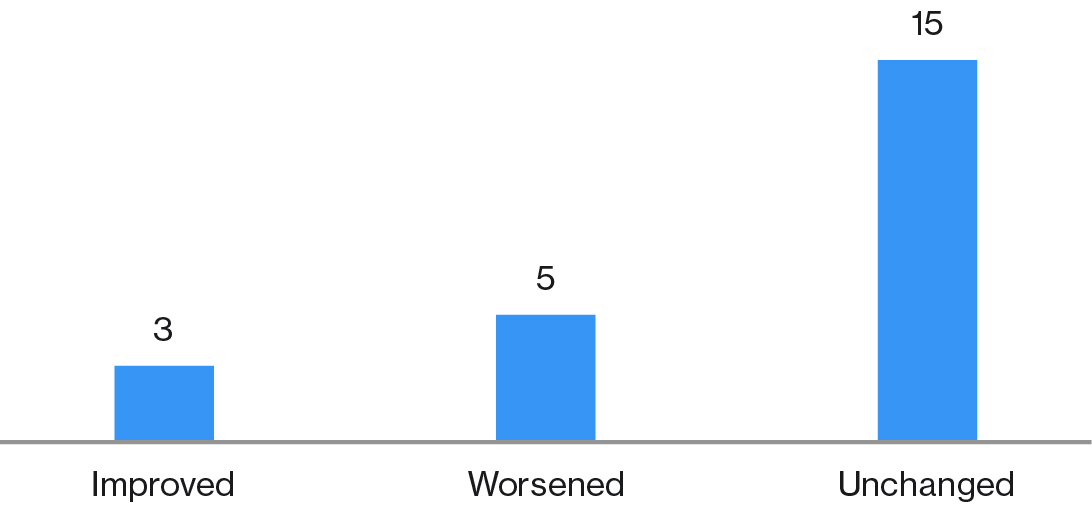
Sources: Statistics Canada; Signal49 Research.
Grades varied by province (Chart 2). Ontario was the only province with an A-grade municipality. Saskatchewan and New Brunswick each had municipalities that received D grades. British Columbia and Manitoba had mostly or only B-grade municipalities, while Quebec had a mix of B and C grades. Alberta and the Atlantic provinces had municipalities that earned primarily C grades.
Chart 2
In 2024, Ontario had the only A grade, while Saskatchewan and New Brunswick had the only D grades
(share of municipalities, per cent, 2024)
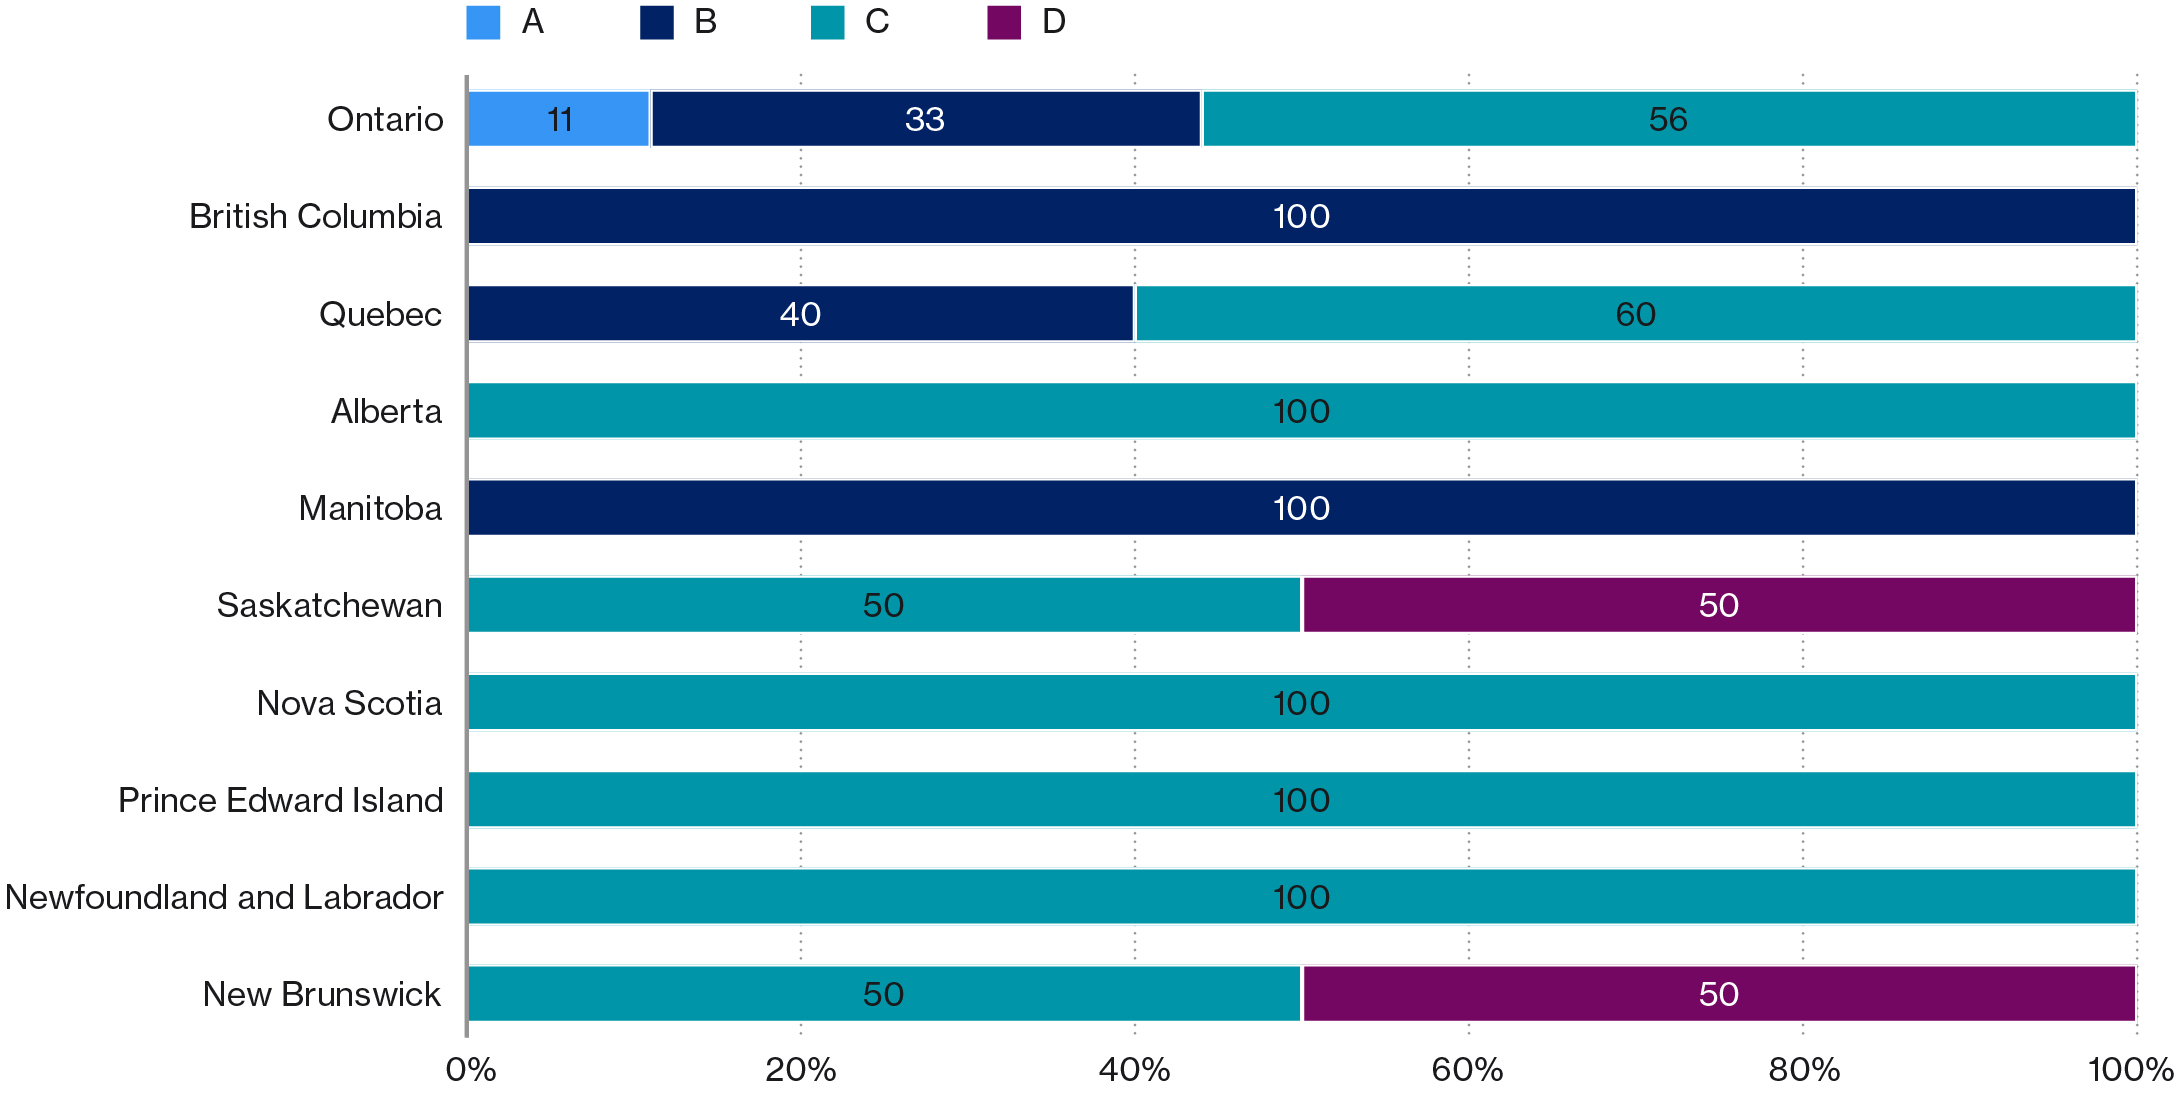
Sources: Statistics Canada; Signal49 Research.
Municipality size appeared to influence immigrant skill utilization (Chart 3). Large municipalities showed mid-range performance—one-third received Bs and the rest received Cs. Medium-sized municipalities showed the widest range in performance, having the only A-grade municipality, a roughly even split of B and C grades, and one with a D grade. Small municipalities had the worst performance, with two receiving a C grade and one a D grade.
Chart 3
In 2024, immigrant skill utilization was weakest in small municipalities and strongest in medium-sized ones
(share of municipalities, per cent, 2024)
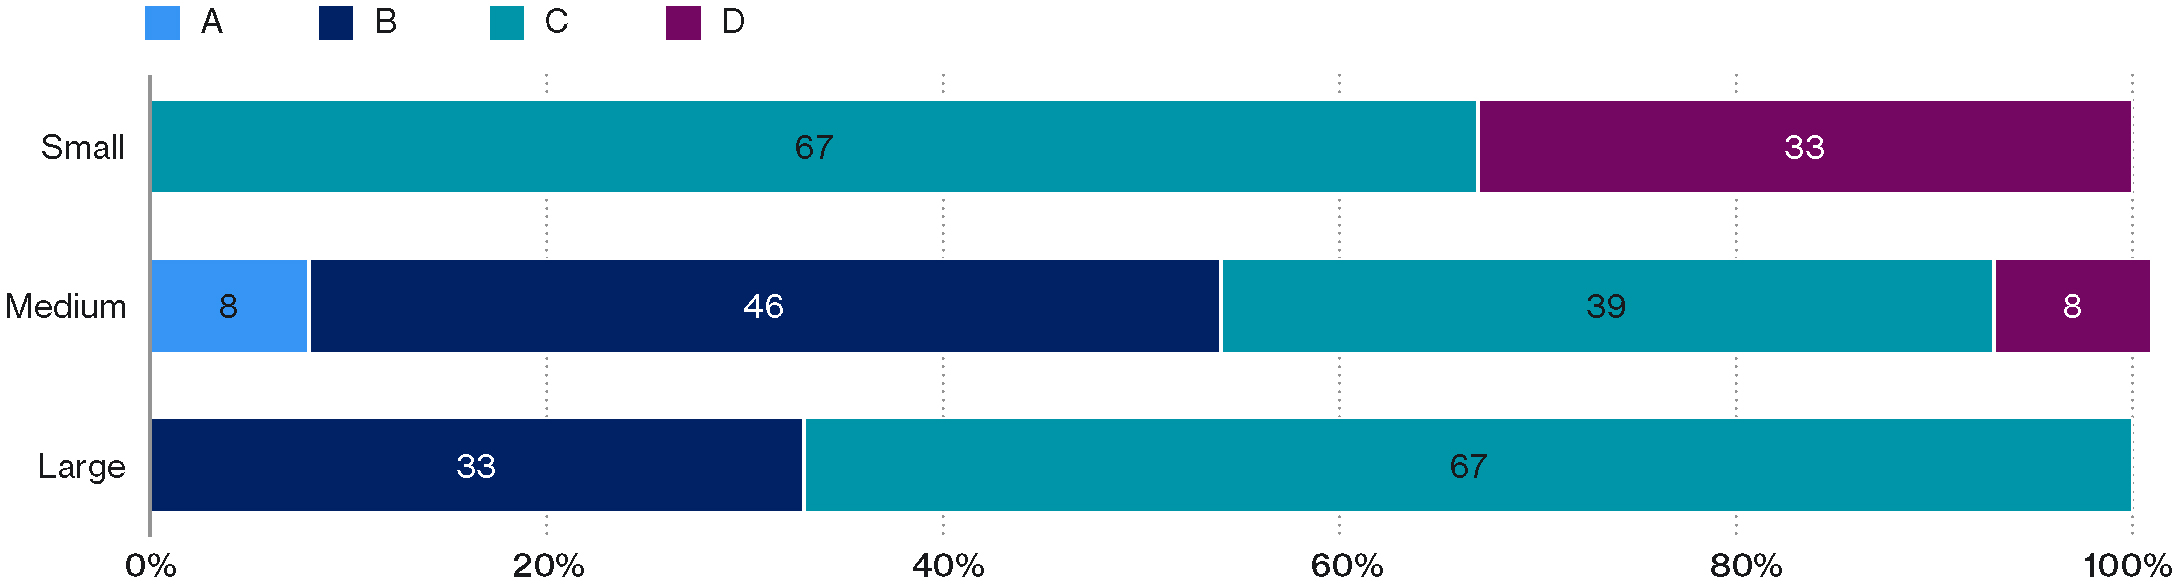
Sources: Statistics Canada; Signal49 Research.

Overeducation is the primary form of immigrant skill underutilization
The main skill underutilization challenge that immigrants faced in 2024 was overeducation, or skill mismatch (Chart 4). The second was involuntary part-time work, a form of skill wastage.
Canadian-born citizens also experienced these issues, but to a lesser degree: Immigrants were 1.8 times more likely to be overeducated for their job and 1.7 times more likely to work part time involuntarily. In contrast, the two groups faced similar rates of unemployment and temporary employment.2
Two areas of focus for efforts to increase immigrant skill utilization are improving the transferability of foreign-earned qualifications and helping immigrants find full-time work.
Chart 4
In 2024, overeducation and involuntary part-time work were the biggest skill utilization challenges for immigrants
(percentage of skill underutilization, 2024)
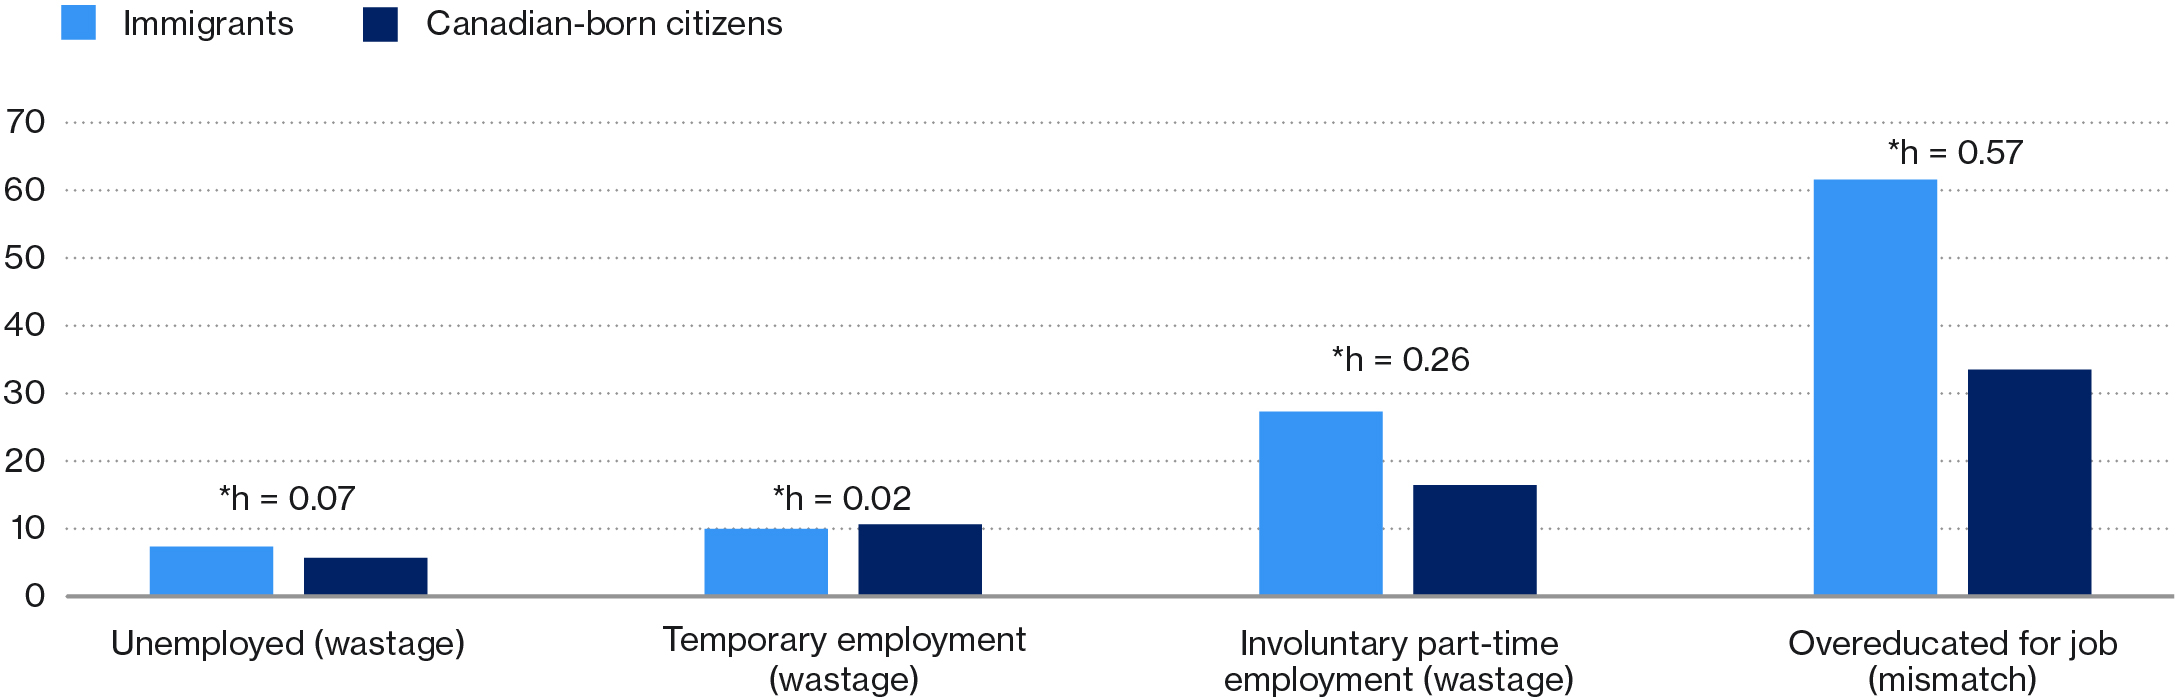
Note: Cohen’s h is an effect size metric that measures the magnitude of the difference between two proportions. Values below 0.20 represent trivial differences. Values between 0.20 and 0.49 represent small differences. Values between 0.50 and 0.79 represent medium differences. All differences were statistically significant (*). See our methodology for more details.
Sources: Statistics Canada; Signal49 Research.
Skill mismatch disparities exist at higher education levels
We saw in Chart 4 that overeducation was the main way immigrants’ skills were underutilized in the labour market in 2024. When we broke this down by educational attainment, we found that immigrants with bachelor’s degrees had the highest overeducation rates (Chart 5).
Comparing immigrants to Canadian-born citizens, the largest difference appeared among those with higher than a bachelor’s degree. Immigrants in this group were 2.3 times more likely to face overeducation than their Canadian-born counterparts. At the bachelor’s level, immigrants were 1.5 times more likely to be overeducated for their job.3
Hence, Canada’s most-educated immigrants face the biggest difference from Canadian-born citizens in terms of obtaining employment that is commensurate with their skills.
Chart 5
In 2024, immigrants with university credentials faced higher overeducation rates than Canadian-born citizens
(percentage overeducated, 2024)
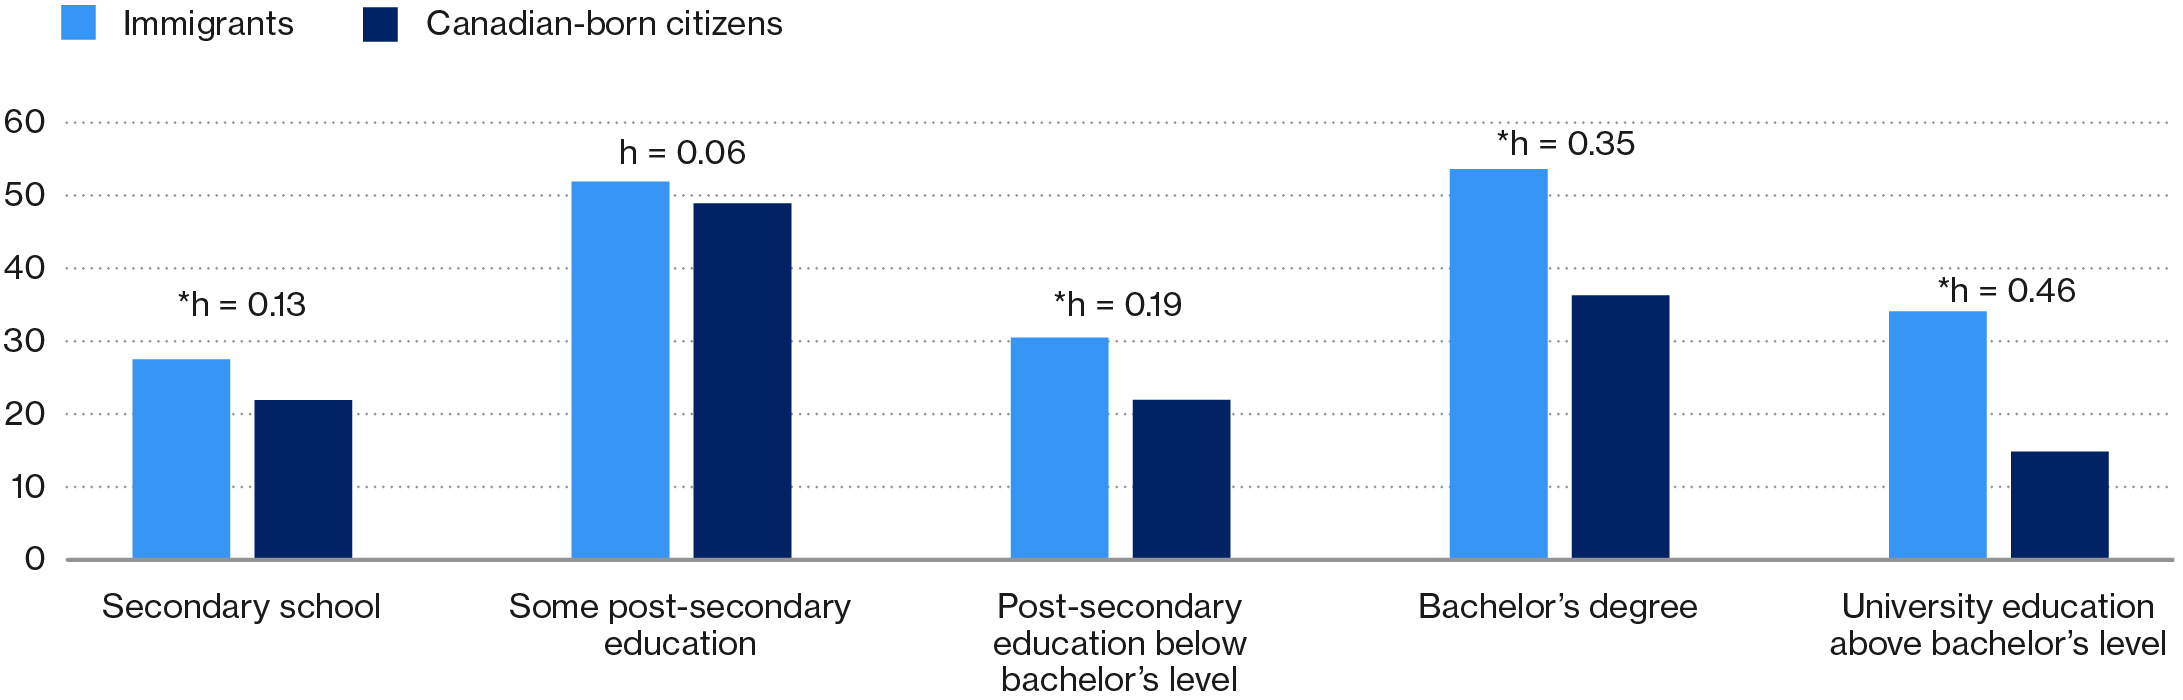
Note: Cohen’s h is an effect size metric that measures the magnitude of the difference between two proportions. Values below 0.20 represent trivial differences. Values between 0.20 and 0.49 represent small differences. Statistically significant differences are marked with an asterisk(*). See our methodology for more details.
Sources: Statistics Canada; Signal49 Research.
Skill mismatch disparities vary by municipality
Immigrants experienced higher rates of skill mismatch than Canadian-born workers—both nationally and in every municipality we examined. But how much better Canadian-born workers fared varied by region (Chart 6).
Atlantic municipalities showed the most variation, with differences ranging from trivial to large. Ontario’s gaps were trivial to small, while Quebec’s were mostly small. British Columbia had small to medium differences, and the Prairies mostly medium to large. See our methodology for how we calculated group differences.
Chart 6
In 2024, immigrants faced higher overeducation rates than Canadian-born citizens in all municipalities but with regional variation
(percentage point differences in overeducation rates favouring Canadian-born citizens, 2024)
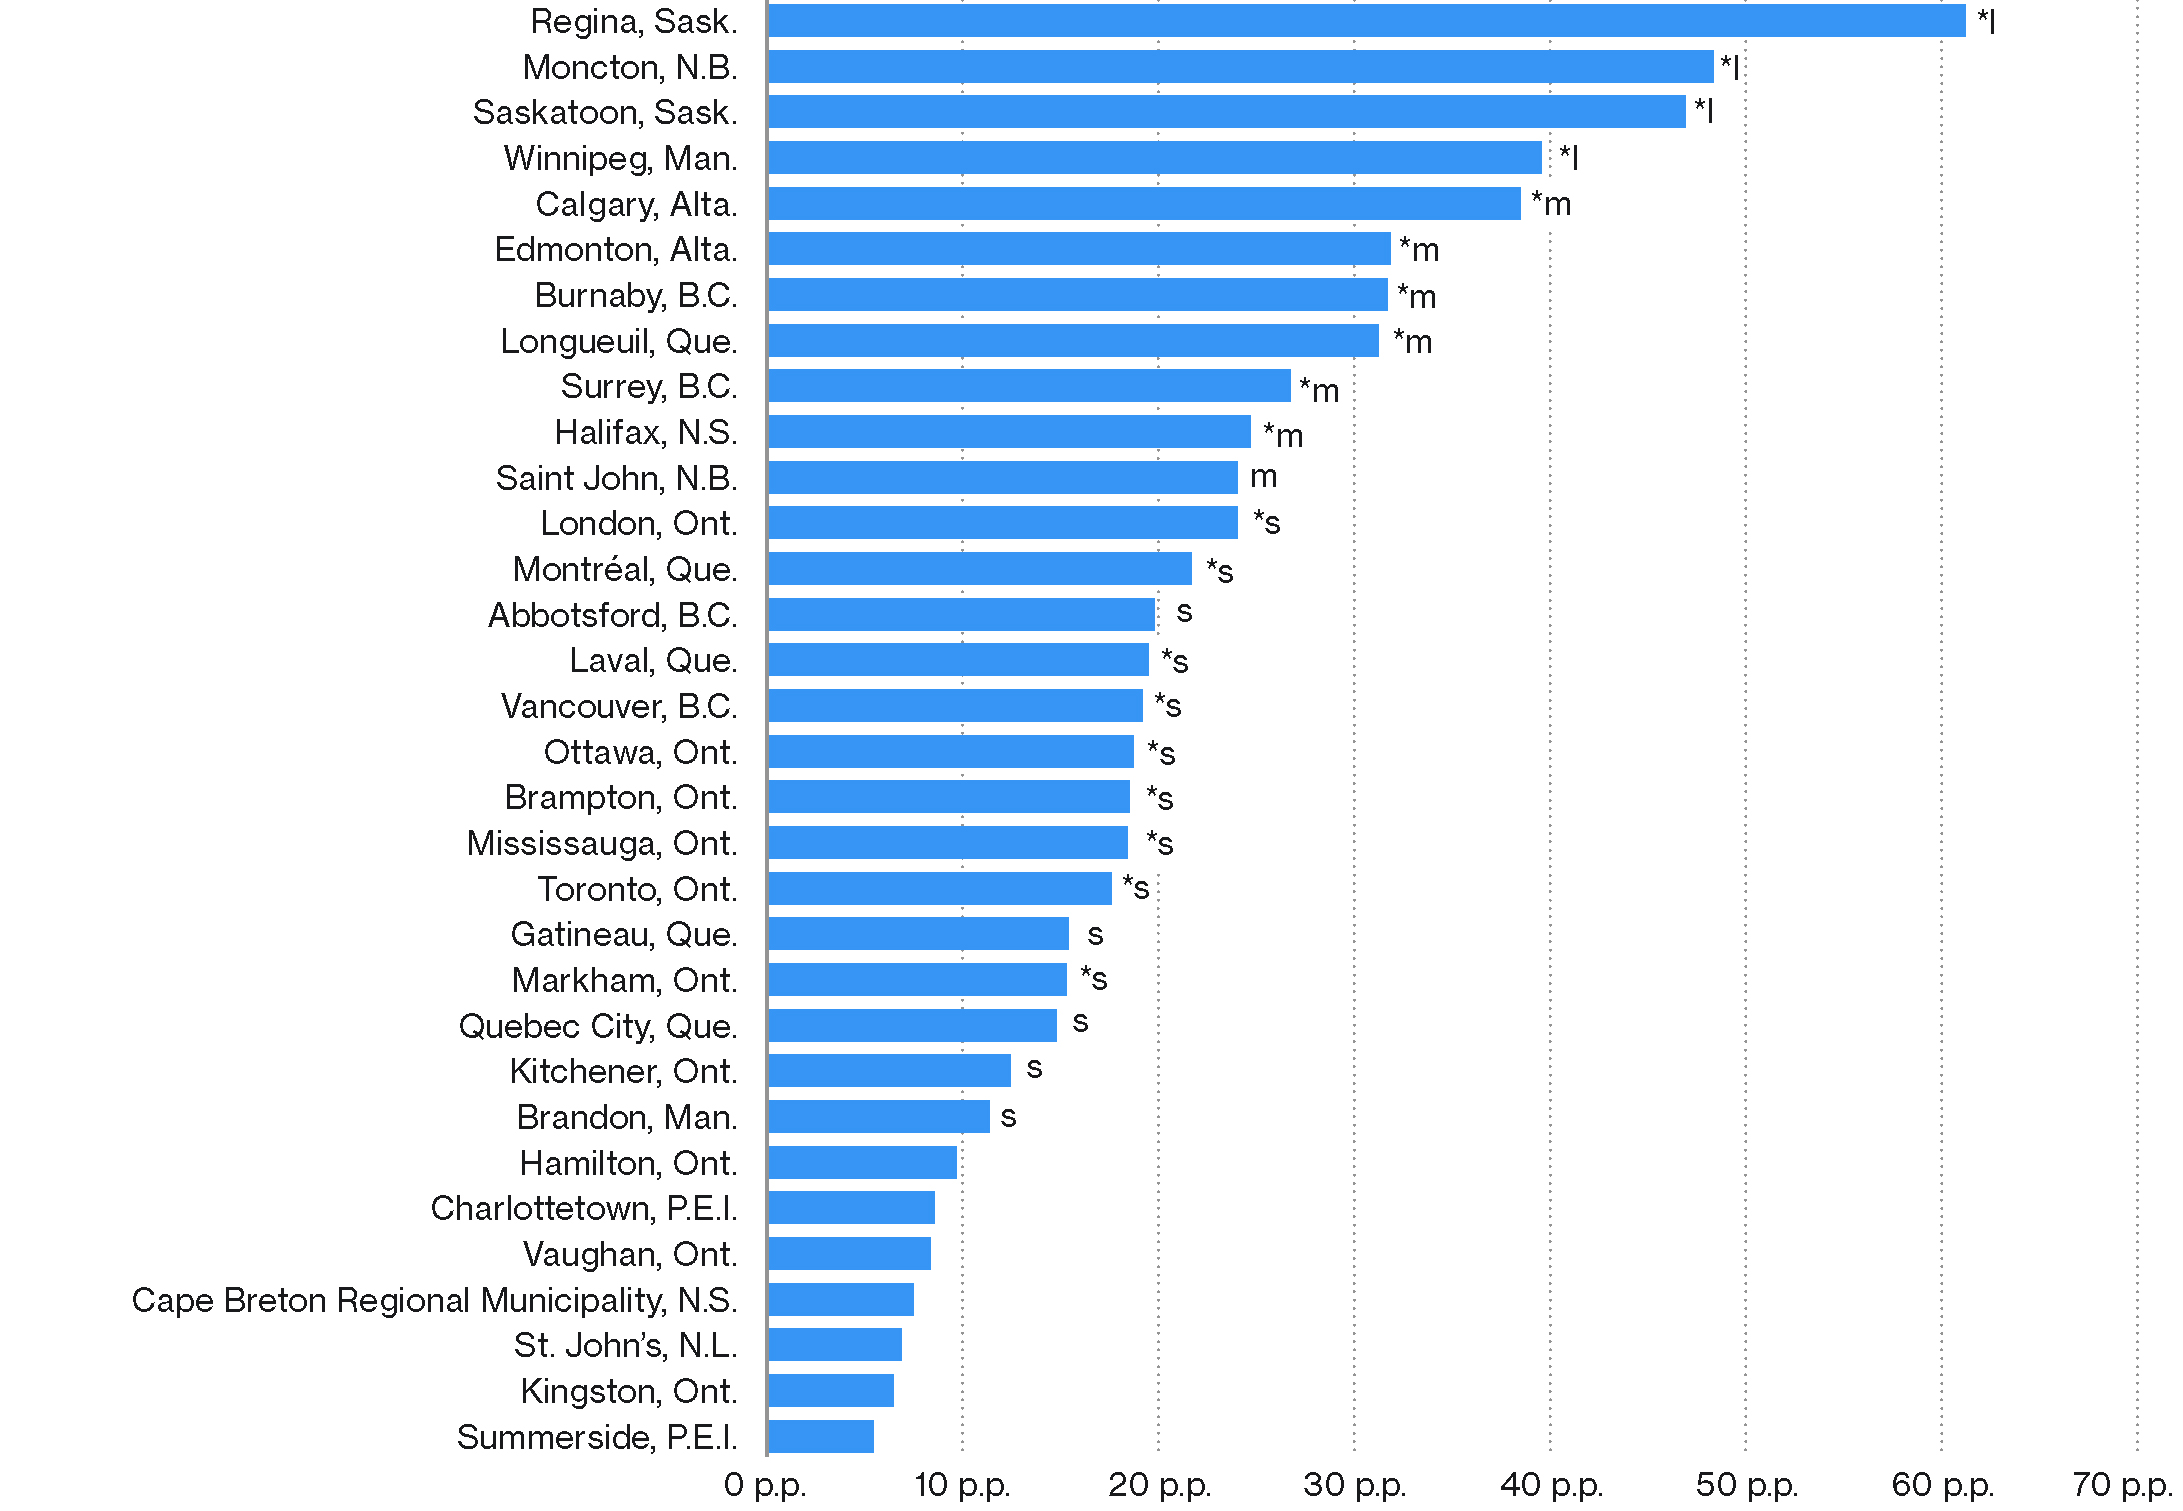
Note: Cohen’s h is an effect size metric that measures the magnitude of the difference between two proportions. Values below 0.20 represent trivial differences, which are not marked. Values of 0.20, 0.50, and 0.80 represent small (s), medium (m), and large differences (l), respectively. Statistically significant differences are marked with an asterisk (*). See our methodology for more details.
Sources: Statistics Canada; Signal49 Research.
Immigrants over-represented as involuntary part-time workers in all municipalities
In 2024, immigrants were over-represented as involuntary part-time workers in all of the municipalities we examined. Canadian-born citizens only experienced a meaningful advantage in roughly half of these municipalities. (See Chart 7 and our methodology.) However, many municipalities were excluded from this analysis due to reporting restrictions, limiting the conclusions we could draw.
Chart 7
In 2024, immigrants faced higher involuntary part-time employment rates than Canadian-born citizens in all municipalities
(percentage point differences in involuntary part-time employment rates favouring Canadian-born citizens, 2024)
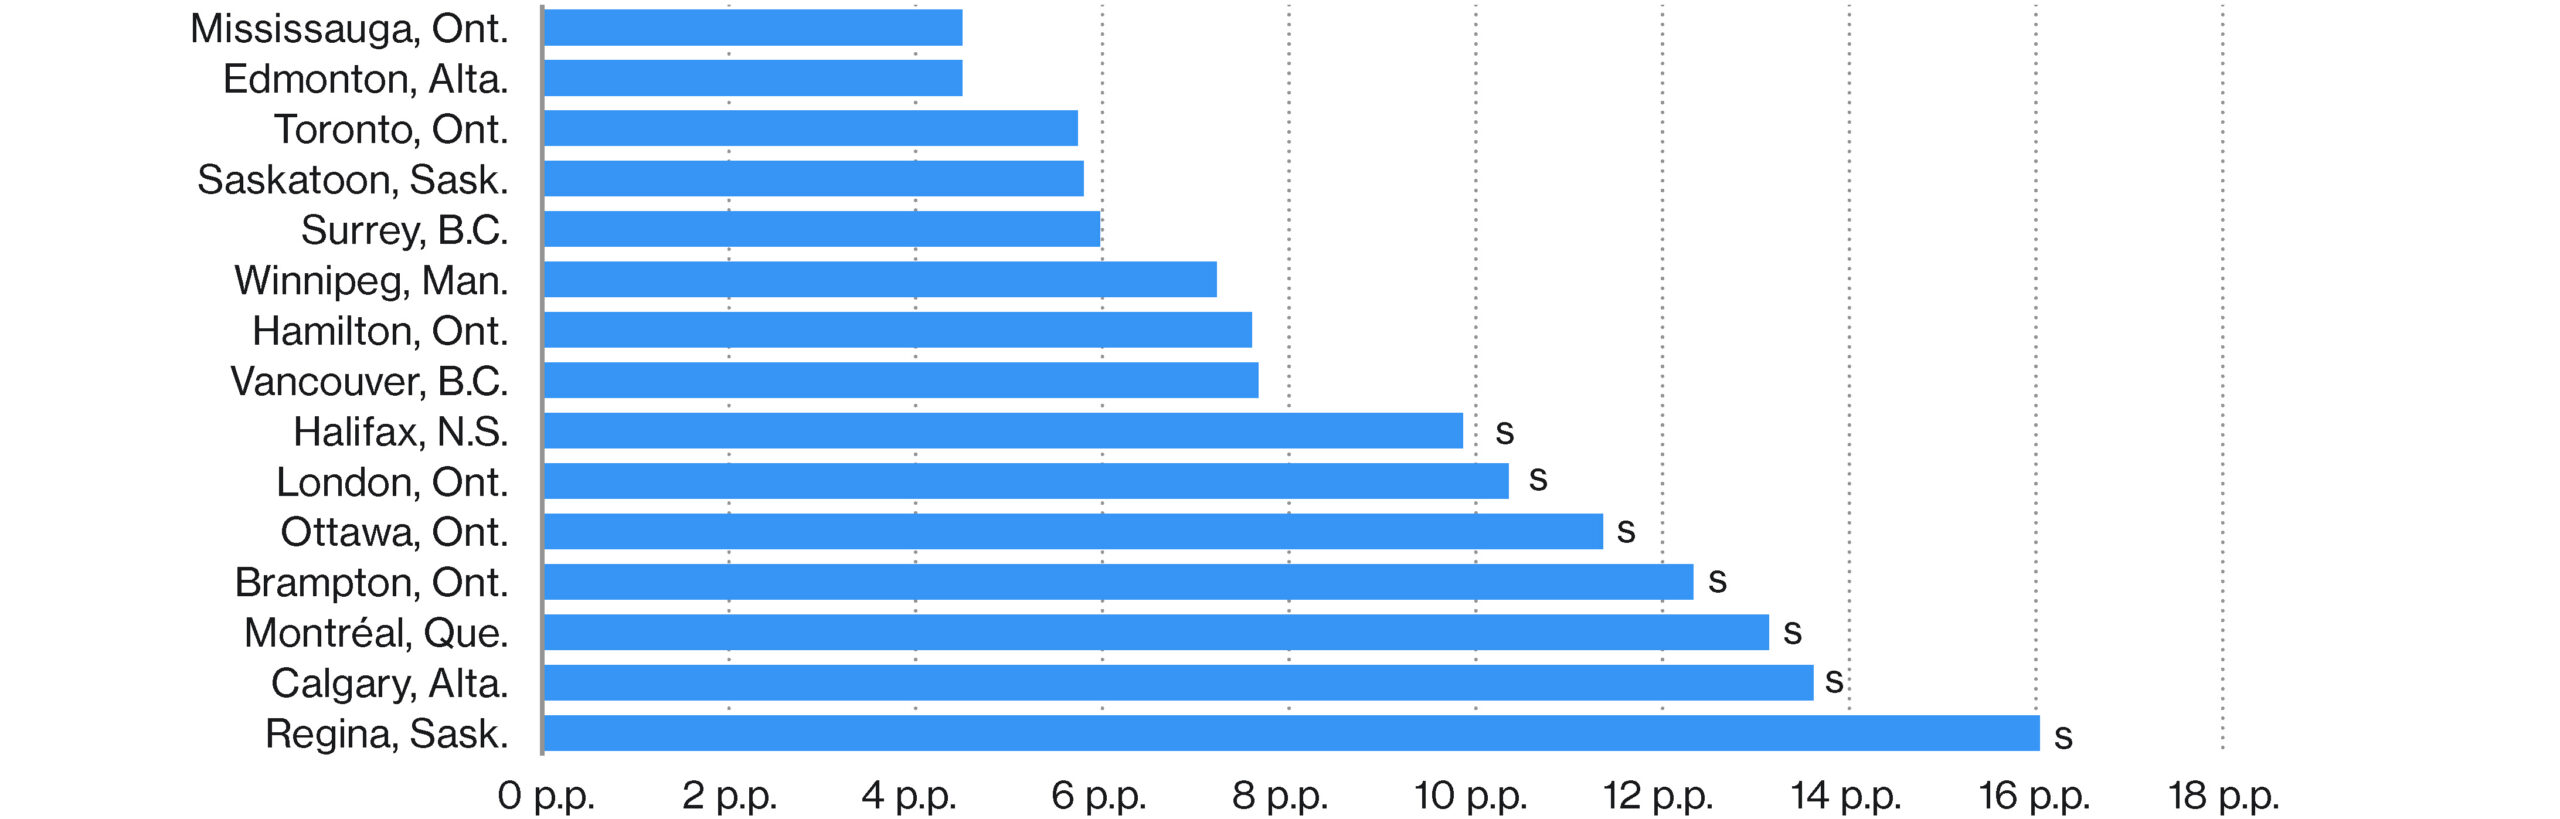
Note: Cohen’s h is an effect size metric that measures the magnitude of the difference between two proportions. Values below 0.20 represent trivial differences. Values between 0.20 and 0.49 represent small differences. Statistically significant differences are marked with an asterisk(*). See our methodology for more details.
Sources: Statistics Canada; Signal49 Research.
Term and contract jobs are more common in immigrants
We saw in Chart 4 that immigrants and Canadian-born citizens experienced similar rates of temporary employment in 2024. However, Chart 8 shows that the types of temporary jobs they held were different. Immigrants were 1.2 times more likely to hold term and contract positions, whereas Canadian-born citizens were 2.2 times more likely to work in seasonal jobs.4
This lower rate of seasonal employment among immigrants might suggest that their work is less precarious than for Canadian‑born citizens. Unlike seasonal roles, term and contract jobs can sometimes offer a clearer pathway to permanent employment. However, an alternate explanation may be appropriate. Our analysis excludes temporary residents, who comprise a large portion of Canada’s seasonal workforce. For example, nearly one in four agricultural employees was a temporary foreign worker in 2022.5 Similarly, most temporary foreign work approvals were given to general farm workers in 2023, with other seasonal jobs in the top 15 (e.g., construction workers, agricultural service contractors).6 Further research is needed to understand the differences we found.
While rates of casual and other temporary employment were similar between the two groups, immigrants’ over-representation in term and contract jobs shows they face barriers to stable employment.
Chart 8
In 2024, immigrants were more likely than Canadian-born citizens to work in term or contract jobs
(percentage in temporary employment, 2024)
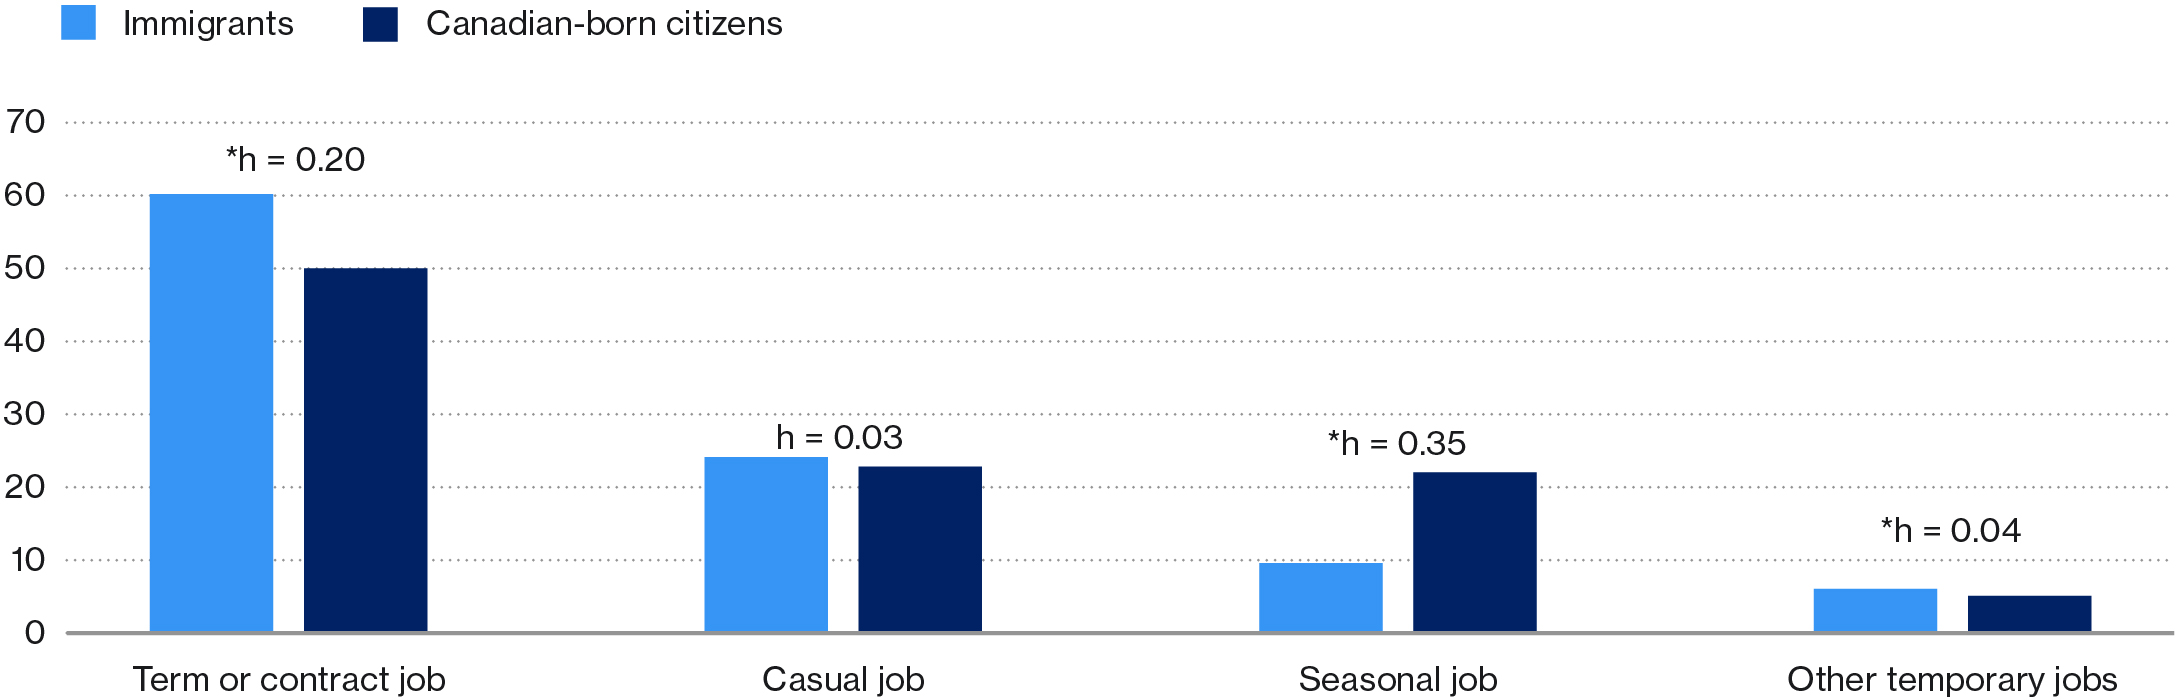
Note: Cohen’s h is an effect size metric that measures the magnitude of the difference between two proportions. Values below 0.20 represent trivial differences. Values between 0.20 and 0.49 represent small differences. Statistically significant differences are marked with an asterisk(*). See our methodology for more details.
Sources: Statistics Canada; Signal49 Research.
Immigrants are particularly over-represented as term and contract employees in Longueuil and under-represented in these roles in Charlottetown
Above, we saw that immigrants were 1.2 times more likely to hold term and contract positions than Canadian-born citizens. When we broke this down by municipality, we found substantial variations in group disparities (Chart 9). The largest gap favouring Canadian-born workers occurred in Longueuil. Term and contract employment rates were 1.5 times higher for immigrants in this municipality. Immigrants were also over-represented as term and contract workers in Brampton, Hamilton, St. John’s, Gatineau, and Quebec City, though to a lesser extent.
Conversely, there was a large gap favouring immigrants in Charlottetown. Term and contract employment rates there were 1.5 times higher for Canadian-born citizens.
Chart 9
In 2024, immigrants were more likely than Canadian-born citizens to work in term and contract jobs in most municipalities
(percentage point differences in term/contract employment rates, above zero favouring Canadian-born citizens, below zero favouring immigrants, 2024)
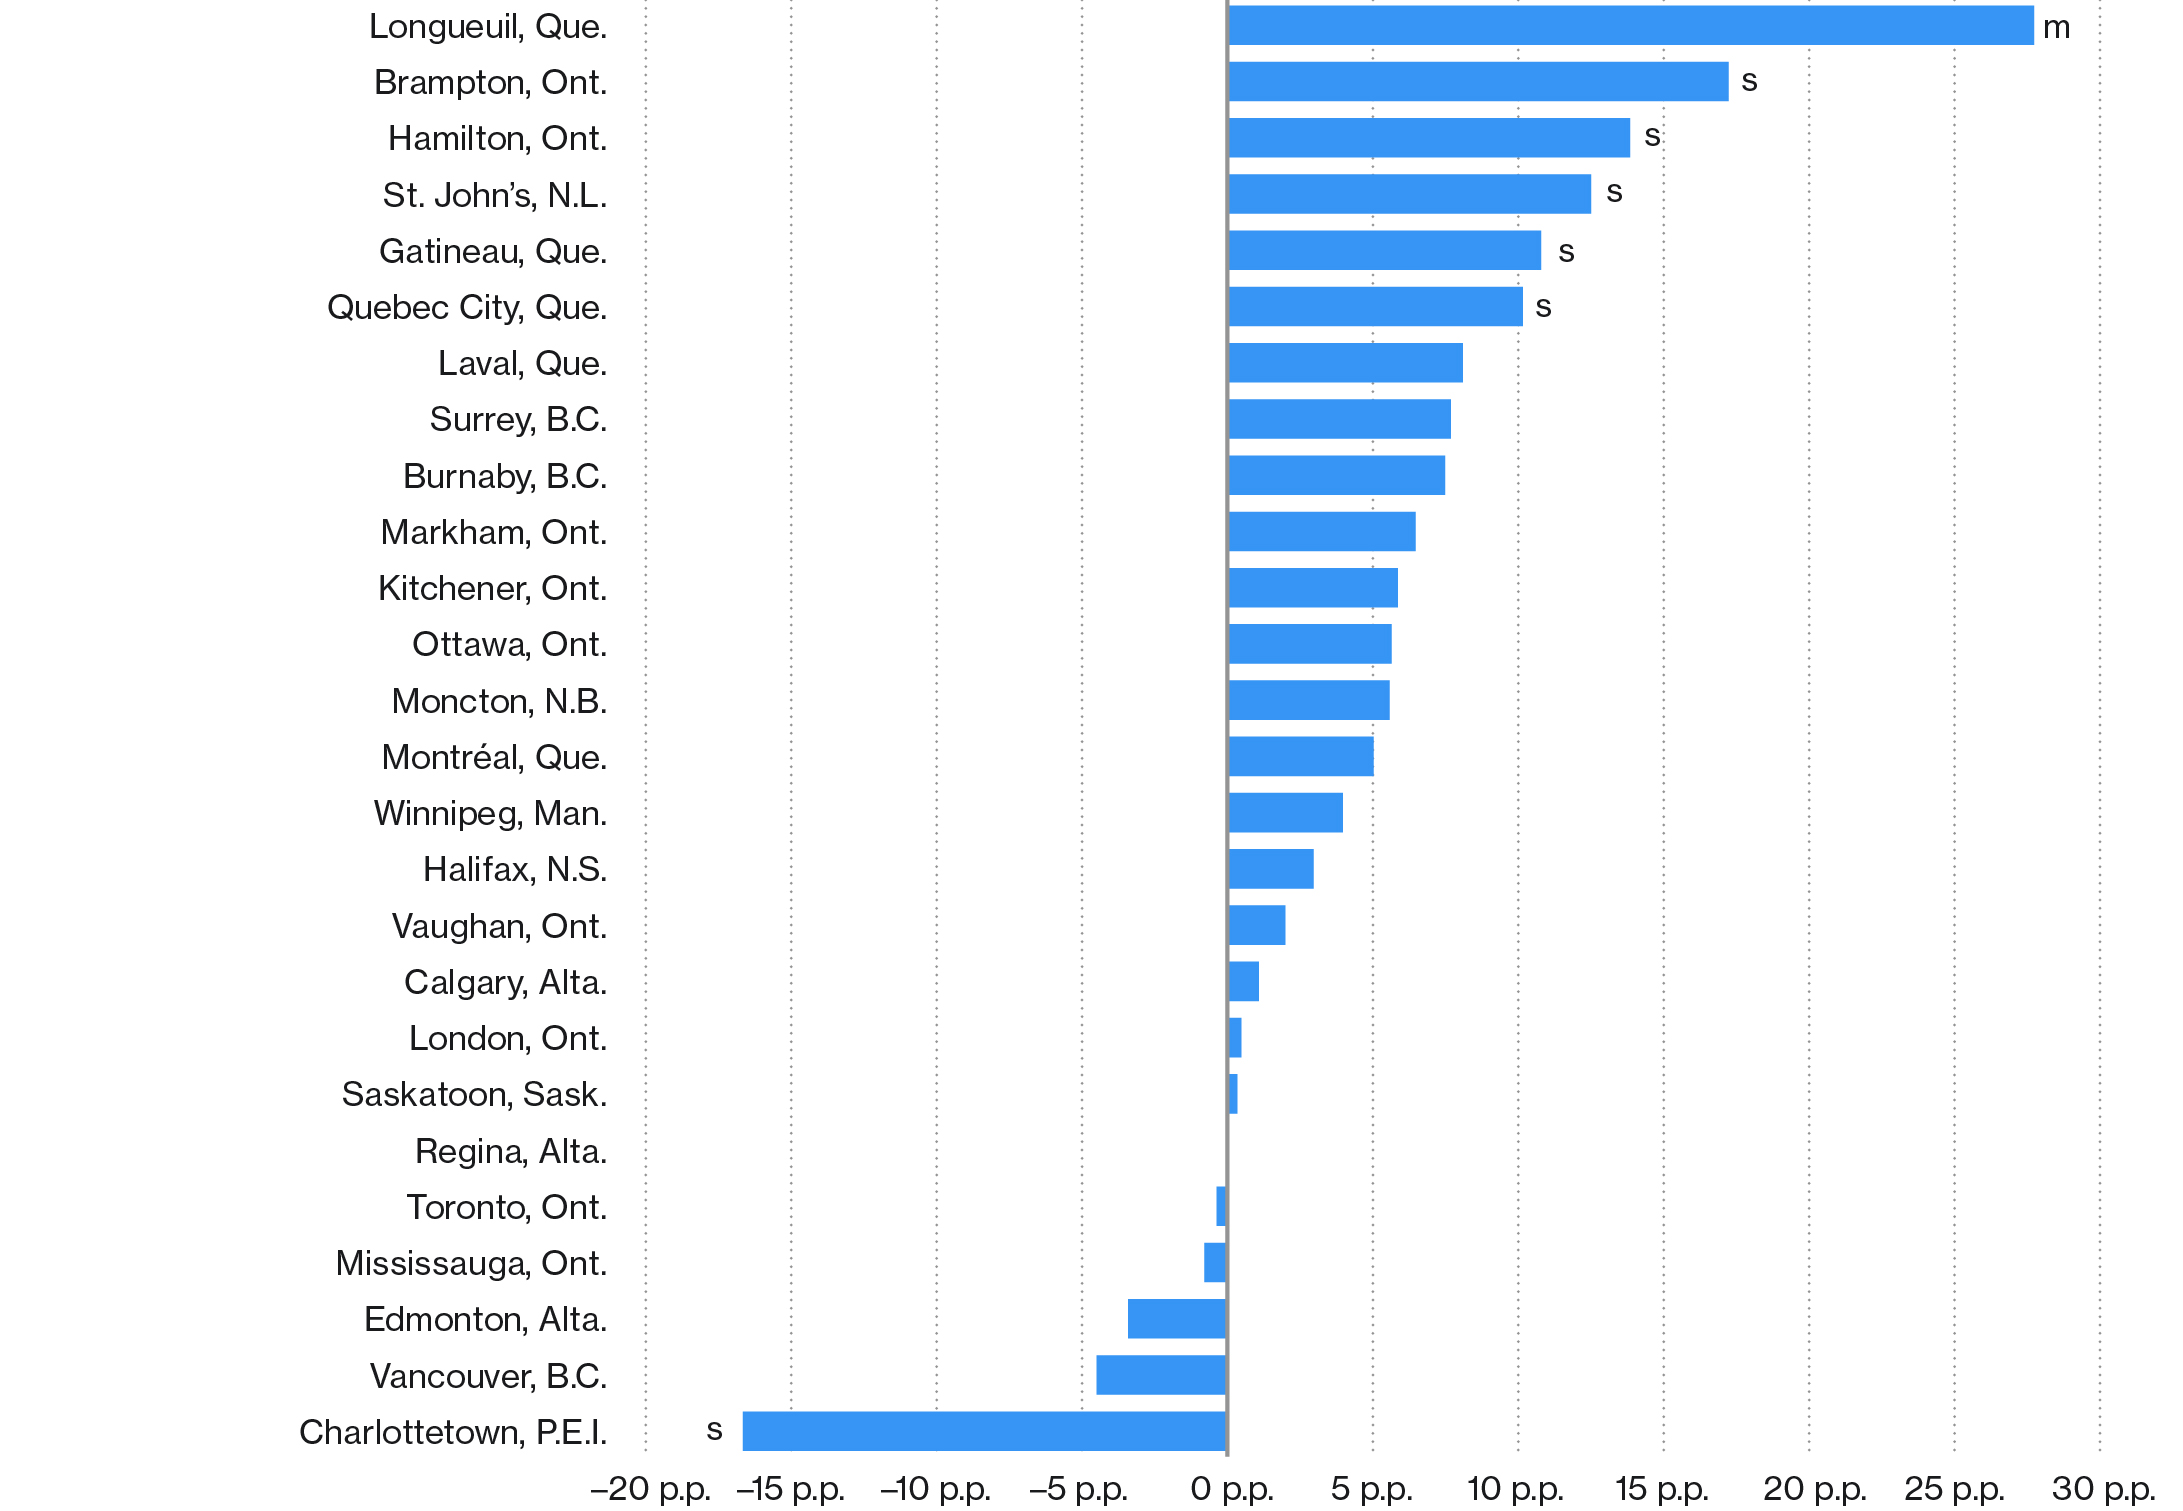
Note: Cohen’s h is an effect size metric that measures the magnitude of the difference between two proportions. Values below 0.20 represent trivial differences, which are not marked. Values between 0.20 and 0.49 represent small (s) differences. Values between 0.50 and 0.79 represent medium (m) differences. None of the differences were statistically significant. See our methodology for more details.
Sources: Statistics Canada; Signal49 Research.
Insights on immigrants’ part-time labour
Our analysis on immigrant skill underutilization included involuntary part-time employment. Involuntary part-time workers are those who work fewer than 30 hours per week due to poor business conditions or because they couldn’t find full-time work. Our data also captured people who chose to work part time—either because they wanted to or because they had other commitments (e.g., academic or caregiving responsibilities). While this “voluntary” part-time employment indicator doesn’t factor into our scorecard results, it reveals interesting differences in what drives people’s decisions to work part time. Understanding these differences can help improve employment outcomes for all immigrants, not just those experiencing skill underutilization.
Comparing groups on their reasons for part-time employment, immigrants were more likely to cite caregiving or personal responsibilities, whereas Canadian-born citizens were more likely to cite schooling (Chart 10).7
Chart 10
In 2024, immigrants were more likely than Canadian-born citizens to cite caregiving or personal responsibilities as a reason for part-time employment
(percentage working part time, 2024)
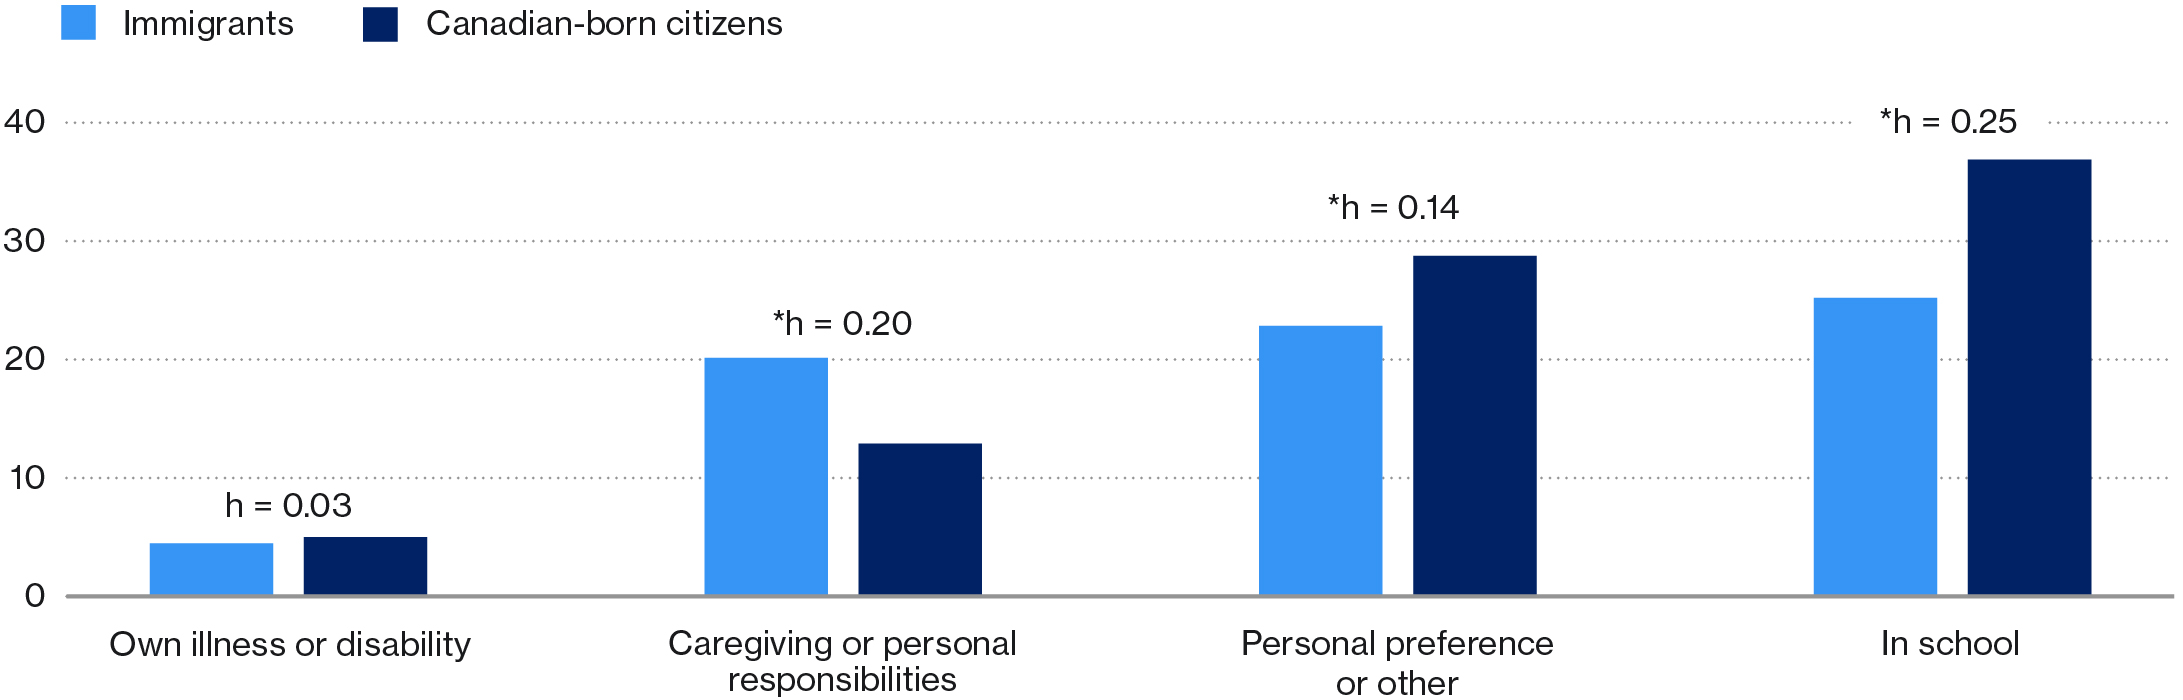
Note: Cohen’s h is an effect size metric that measures the magnitude of the difference between two proportions. Values below 0.20 represent trivial differences. Values between 0.20 and 0.49 represent small differences. Statistically significant differences are marked with an asterisk(*). See our methodology for more details.
Sources: Statistics Canada; Signal49 Research.
Sectoral insights
Immigrants are essential to Canada’s workforce. In 2024, they made up 20 per cent of full-time workers in construction, 30 per cent in healthcare, and 38 per cent in hospitality.
Yet many faced underutilization in these sectors. Compared to Canadian-born citizens, immigrants were far more likely to be overeducated for their roles—2.6 times in construction, 2.2 times in healthcare, and 1.4 times in hospitality. They also faced higher rates of involuntary part-time employment—1.8 times higher in construction and 1.6 times higher in healthcare.
The employment barriers that drive immigrant skill utilization vary by sector. For an in-depth analysis and tailored strategies to address these barriers, see our issue briefings on healthcare (forthcoming), construction (forthcoming), and hospitality (forthcoming).
This research was prepared with financial support provided through the Government of Canada’s Future Skills Centre. Signal49 Research is proud to serve as a research partner in the Future Skills Centre consortium.
Many individuals at Signal49 Research helped to bring this research to life. Lauren Hamman, Associate Director provided oversight throughout the research process. Stein Monteiro, Lead Research Associate, Bronwen Perley-Robertson, Senior Research Associate, and Federica Guccini, Research Associate, executed the research. Stefan Fournier, Executive Director, provided feedback on early drafts. This online experience was designed by the Design Services team at Signal49 Research.
We also wish to thank the members of our research advisory board who supported this research:
- Henry Akanko, Director, Hire Immigrants Ottawa
- Rupa Banerjee, Canada Research Chair, Toronto Metropolitan University
- Laurie Beckstead, Director of Programs, Ottawa Community Loan Fund
- Bianca Cooper, General Manager, Impact Drywall Inc.
- Joëlle Cupidon, Director, People & Culture, Healthcare Excellence Canada
- Evan Hazenberg, Research Director, Tourism HR Canada
- Jasmine Qi, Director, Workforce Inclusion, Tourism HR Canada
- Donald Guse Salah, Director, Restaurants Canada
- Dale Schierbeck, Independent Healthcare Expert
- Carol Yuan, Employment Liaison Specialist, BC Construction Association
See the methodology:
- The Conference Board of Canada, The Future of Work: Addressing Skill Imbalances in Canada (2024), https://fsc-ccf.ca/wp-content/uploads/2024/12/the-future-of-work_2024.pdf.
- These differences between immigrants and Canadian-born citizens were statistically significant but varied in size. There was a medium difference in overeducation (h = 0.57), a small difference in involuntary part-time employment (h = 0.26), and trivial differences in unemployment (h = 0.07) and temporary employment (h = 0.02). See our methodology for more information.
- These differences were both statistically significant and small in magnitude (h = 0.35 and 0.46). Immigrants with secondary and post-secondary education below the bachelor’s level also faced significantly higher rates of overeducation than Canadian-born citizens, but these differences were trivial in size (h = 0.13 and 0.19). The group difference among those with some post-secondary education was both nonsignificant and trivial in size (h = 0.06). See our methodology for more information.
- These group differences were statistically significant and meaningful in size (both were small: h = 0.20 and 0.35). See our methodology for more information.
- Statistics Canada, “A Look at Those at Work in Agriculture,” April 18, 2024, https://www.statcan.gc.ca/o1/en/plus/6075-look-those-work-agriculture.
- CBC News, “From Fast Food to Construction, Employers Turn More and More to Temporary Foreign Workers,” CBC News, June 24, 2024, https://www.cbc.ca/news/canada/calgary/temporary-foreign-workers-1.7240374.
- These group differences were statistically significant and meaningful in size (both were small: h = 0.20 and 0.20). Canadian-born citizens were significantly more likely to work part time due to personal preferences, but this difference was trivial in size (h = 0.14). The group difference for illness/disability was both nonsignificant and trivial in size (h = 0.03). See our methodology for more information.
FSC partners
The responsibility for the findings and conclusions of this research rests entirely with Signal49 Research.