

Behind the Numbers
Unpacking the economics of immigration
How can immigration fuel Canada’s post-pandemic recovery and long-term growth?
May 12, 2021
Our scenarios
We wanted to find out what would happen to Canada’s economy over the next 20 years under four different immigration scenarios: current levels, lower levels, higher levels, and a different composition of incoming immigrants.

Maintain
Our baseline scenario starts with the current immigration levels plan for the next three years. For the remainder of our forecast, immigration levels average around 1.1 per cent of the Canadian population.

Lower
Immigration levels in our low-immigration scenario average about 0.6 per cent of the Canadian population.

Higher
Immigration levels in our high-immigration scenario average about 1.3 per cent of the Canadian population.

Different
In our alternate composition scenario, immigration levels are the same as our baseline scenario. But we’ve lowered the share of economic class immigrants by 8 percentage points and raised the shares of the refugee class by 3 percentage points and the family class by 5 percentage points.

Immigrants across all entry categories
- Invest in Canada
- Work and pay taxes
- Purchase goods and services
- Reverse population aging
Learn more about immigration during the pandemic.
How does immigration affect the economy?
GDP
GDP measures the total economic activity occurring within an economy.
GDP growth increases when immigration levels are high. Immigration presents a strong opportunity for Canada to increase its long-run economic growth, especially since Canada has had trouble growing its GDP through productivity increases.
GDP forecast
(2012 $ trillions)
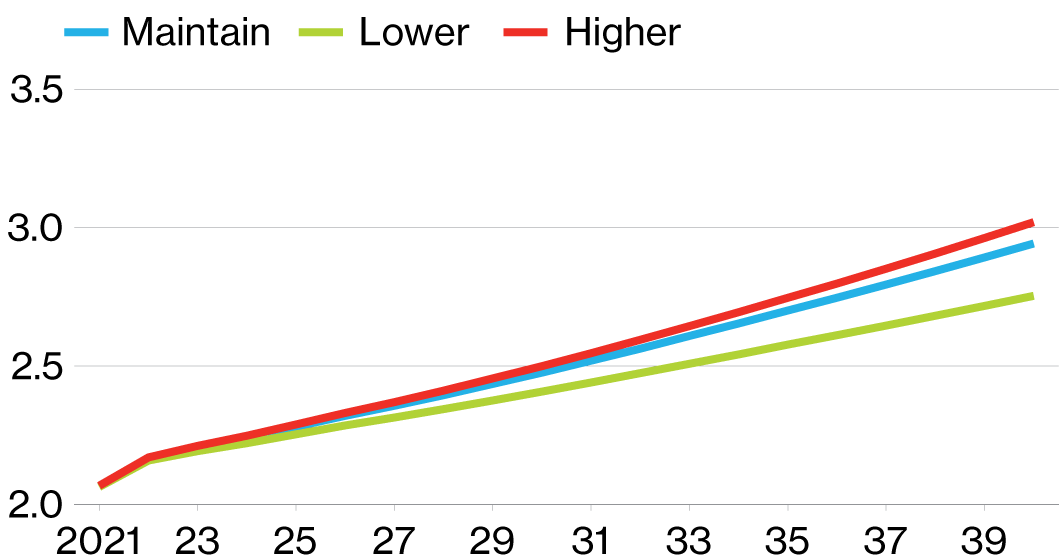
Sources: Signal49 Research; Statistics Canada; IRCC.
Worker ratio
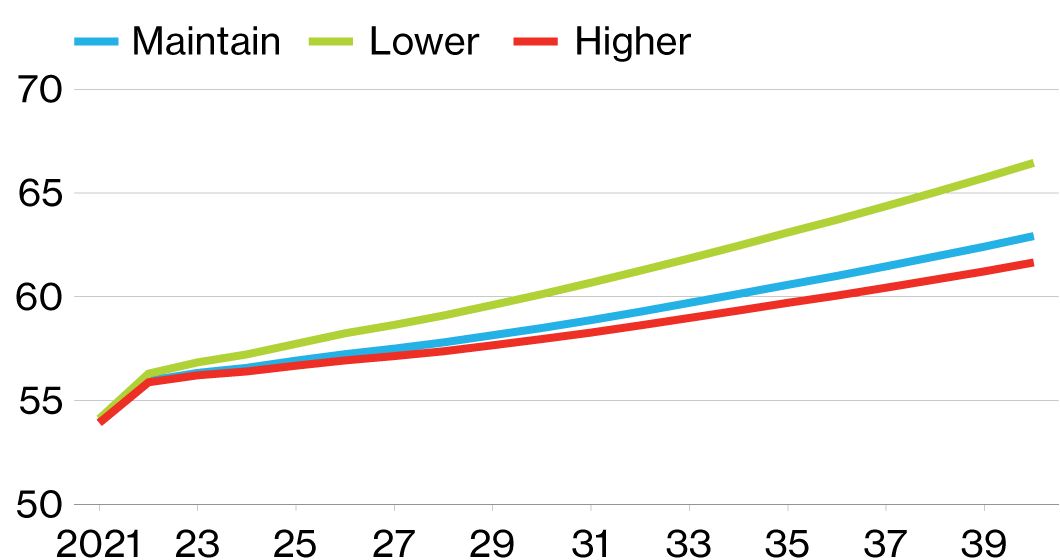
The worker ratio refers to the ratio between working-aged people and the number of retirees.
Immigration improves the worker ratio. A higher ratio of workers to retirees helps support Canada’s social safety net, which is increasingly important as our population ages. On the other hand, a low worker ratio limits productivity and the standard of living.
Ensuring all immigrants of working age can participate in the labour force at their full potential will help maximize economic benefits.
Expected worker ratio
(working-aged population to number of retirees, per cent)

Sources: Signal49 Research; Statistics Canada; IRCC.
Revenues
Public revenues refers to federal government earnings such as income tax and employment insurance contributions.
Immigrants across entry categories contribute to public revenues. High public revenues help maintain our high living standards by supporting important social services such as healthcare and education.
Expected public revenues
($ billions)
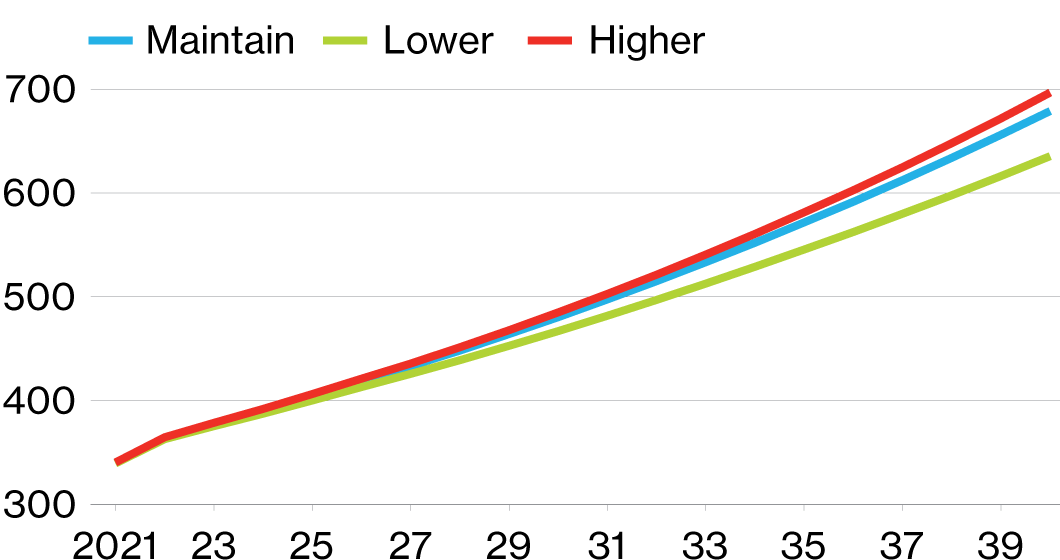
Sources: Signal49 Research; Statistics Canada; IRCC.
GDP per capita
GDP per capita refers to a country’s total economic output divided by its population. GDP per capita is a good measure of a country’s economic prosperity.
GDP per capita falls slightly when immigration levels rise. This is because Canada’s total population grows faster than GDP at higher immigration levels. However, arrivals could bring skills that complement the existing workforce, which would increase productivity and foreign investment—two factors of GDP our model doesn’t capture.
Targeted policy choices and initiatives can help mitigate the decrease in GDP per capita. These include ensuring that newcomers work in jobs that match their level of education and work experience, and attracting more newcomers who will innovate and start new businesses.
Forecast GDP per capita
(2012 $ 000s)
Sources: Signal49 Research; Statistics Canada; IRCC.
Different composition
The share of each immigration category is different in this scenario to observe how it might affect the economy.
The alternate composition scenario has similar economic outcomes as the baseline scenario. This suggests the government could make modest tweaks to the mix of immigrants, such as decreasing the share of economic immigrants, without negatively impacting the economy.
Immigrant composition
(2012 $ 000s)
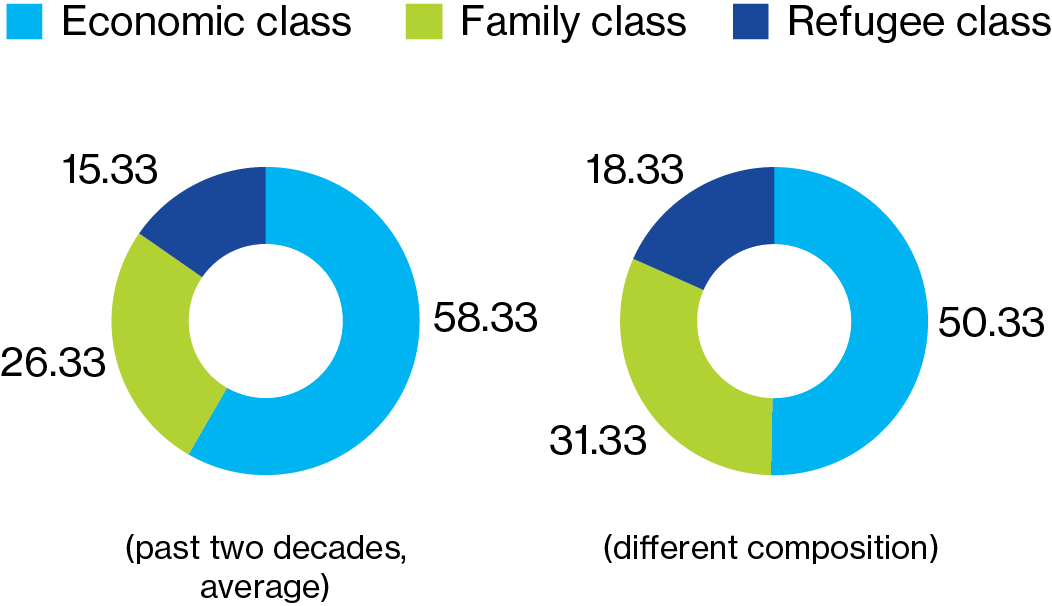
Sources: Signal49 Research; Statistics Canada; IRCC.
Full methodology is available in the issue briefing.

Our next steps
We’ll be updating our economic impact analysis annually. Stay tuned for regional and sectoral case studies.
Do you work in the immigrant-serving sector or government? Are you an employer or do you represent a group of employers in an immigrant-intensive sector? We want to hear from you.
Contact us to learn more about the research and get involved.