

Metropolitan Housing Starts
Housing Starts Falls Below Six-Month Average in Majority of CMAs
Key findings
- There are four CMAs in the up-up quadrant this month, one more than the previous month.
- Just over half of the CMAs in this outlook had lower housing starts in March than their three-month moving average. March starts were lower than the six-month moving average in three-quarters of the CMAs.
- The CMAs with the biggest year-over-year percentage decrease in housing starts in March were Kingston, Thunder Bay, Victoria, Saskatoon, and Sherbrooke.
- Moncton had the largest year-over-year percentage increase in starts last month.
Expectations quadrant
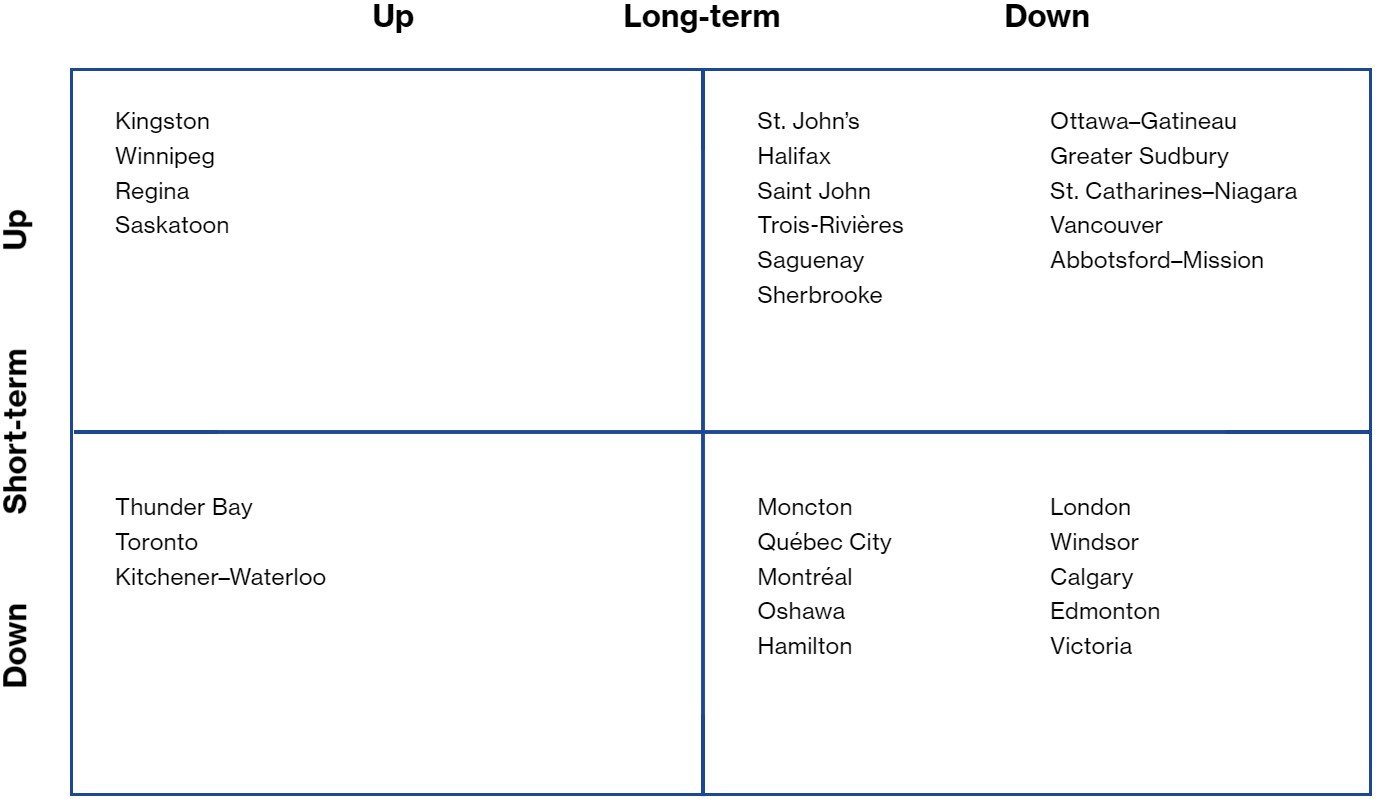
*While residential permit data from the past six months suggest that starts will rise in Abbotsford–Mission in the short term, recent flooding in the area may make this impossible.
Note: Positioning in the quadrant indicates short- and long-term expectation for each CMA’s housing market. The best position would be in the Up-Up quadrant which shows positive prospects for both short- and long-term growth. The worst position would be the Down-Down quadrant.
Sources: Signal49 Research; CMHC Housing Market Information Portal.
Moncton had the largest year-over-year percentage increase in starts last month.
Metropolitan Housing Starts
| Expectations | ||||||||
| Year ago | 6 mon. MA | 3 mon. MA | Mar. 2022 | Short-term* | Long-term** | |||
| St. John’s | 692 | 883 | 1,213 | 1,611 | + | – | ||
| Halifax | 2,665 | 4,917 | 3,022 | 1,467 | + | – | ||
| Saint John | 265 | 509 | 484 | 439 | + | – | ||
| Moncton | 303 | 1,512 | 656 | 1,174 | – | – | ||
| Québec CMA | 7,065 | 8,326 | 7,992 | 10,597 | – | – | ||
| Montréal | 30,629 | 25,596 | 22,069 | 23,479 | – | – | ||
| Trois-Rivières | 1,285 | 1,103 | 683 | 462 | + | – | ||
| Saguenay | 483 | 936 | 1,238 | 826 | + | – | ||
| Sherbrooke | 4,053 | 2,466 | 1,834 | 1,172 | + | – | ||
| Ottawa–Gatineau | 15,347 | 13,168 | 12,628 | 16,713 | + | – | ||
| Kingston | 3,113 | 1,573 | 477 | 117 | + | + | ||
| Greater Sudbury | 4,400 | 474 | 645 | 1,586 | + | – | ||
| Thunder Bay | 1,007 | 132 | 126 | 90 | – | + | ||
| Oshawa | 5,513 | 1,927 | 1,428 | 2,079 | – | – | ||
| Toronto | 63,077 | 43,371 | 42,584 | 39,741 | – | + | ||
| Hamilton | 1,587 | 3,066 | 2,314 | 2,701 | – | – | ||
| St. Catharines–Niagara | 3,732 | 2,266 | 1,901 | 1,752 | + | – | ||
| Kitchener–Waterloo | 4,401 | 4,079 | 2,573 | 4,019 | – | + | ||
| London | 3,428 | 3,280 | 3,371 | 2,788 | – | – | ||
| Windsor | 804 | 1,357 | 1,374 | 1,360 | – | – | ||
| Winnipeg | 3,535 | 5,343 | 5,865 | 4,621 | + | + | ||
| Regina | 1,235 | 993 | 700 | 861 | + | + | ||
| Saskatoon | 4,362 | 1,555 | 1,658 | 1,242 | + | + | ||
| Calgary | 14,005 | 15,596 | 12,932 | 16,368 | – | – | ||
| Edmonton | 9,998 | 12,631 | 11,325 | 11,700 | – | – | ||
| Vancouver | 44,909 | 20,066 | 17,905 | 14,218 | + | – | ||
| Victoria | 7,231 | 4,354 | 3,367 | 1,457 | – | – | ||
| Abbotsford–Mission | 789 | 1,370 | 1,504 | 1,019 | + | – | ||
Starts seasonally adjusted, annual rate.
*short-term expectations are based on residential permits data
**long-term expectations are based on demographic requirements
Sources: Signal49 Research; CMHC Housing Market Information Portal.
Disclaimer: Forecasts and research often involve numerous assumptions and data sources and are subject to inherent risks and uncertainties. This information is not intended as specific investment, accounting, legal, or tax advice.
Please note that our forecast was completed during Russia’s continuing invasion of Ukraine. Although the situation remains fluid, the core elements of the forecast presented in this briefing stand at publication. For Canada, we expect the largest implications of Russia’s actions will be on commodity and consumer prices. Visit signal49.ca for our latest insights. Signal49 Research reserves the right to adjust content as necessary.
About the Metropolitan Housing Starts
The monthly Metropolitan Housing Starts publication provides the recent trends in housing starts for 28 metropolitan areas and expectations for starts over both the short and long term.
Any errors or omissions in fact or interpretation are the responsibility of Signal49 Research.