

Metropolitan Housing Starts
Positive Expectations Continue to Outweigh Negative for the Short Term
Key Findings
- There are eight CMAs in the Up-Up quandrant this month, up six from last month.
- The CMAs with the biggest year-over-year percentage decrease in housing starts in July were Saint John, Québec City, Thunder Bay, London, and St. Catharines–Niagara.
- Nearly a third of the CMAs still have postive expectations for the short term.
- Abbotsford–Mission had the largest year-over-year percentage increase in starts in the latest month of data.
Expectations quadrant
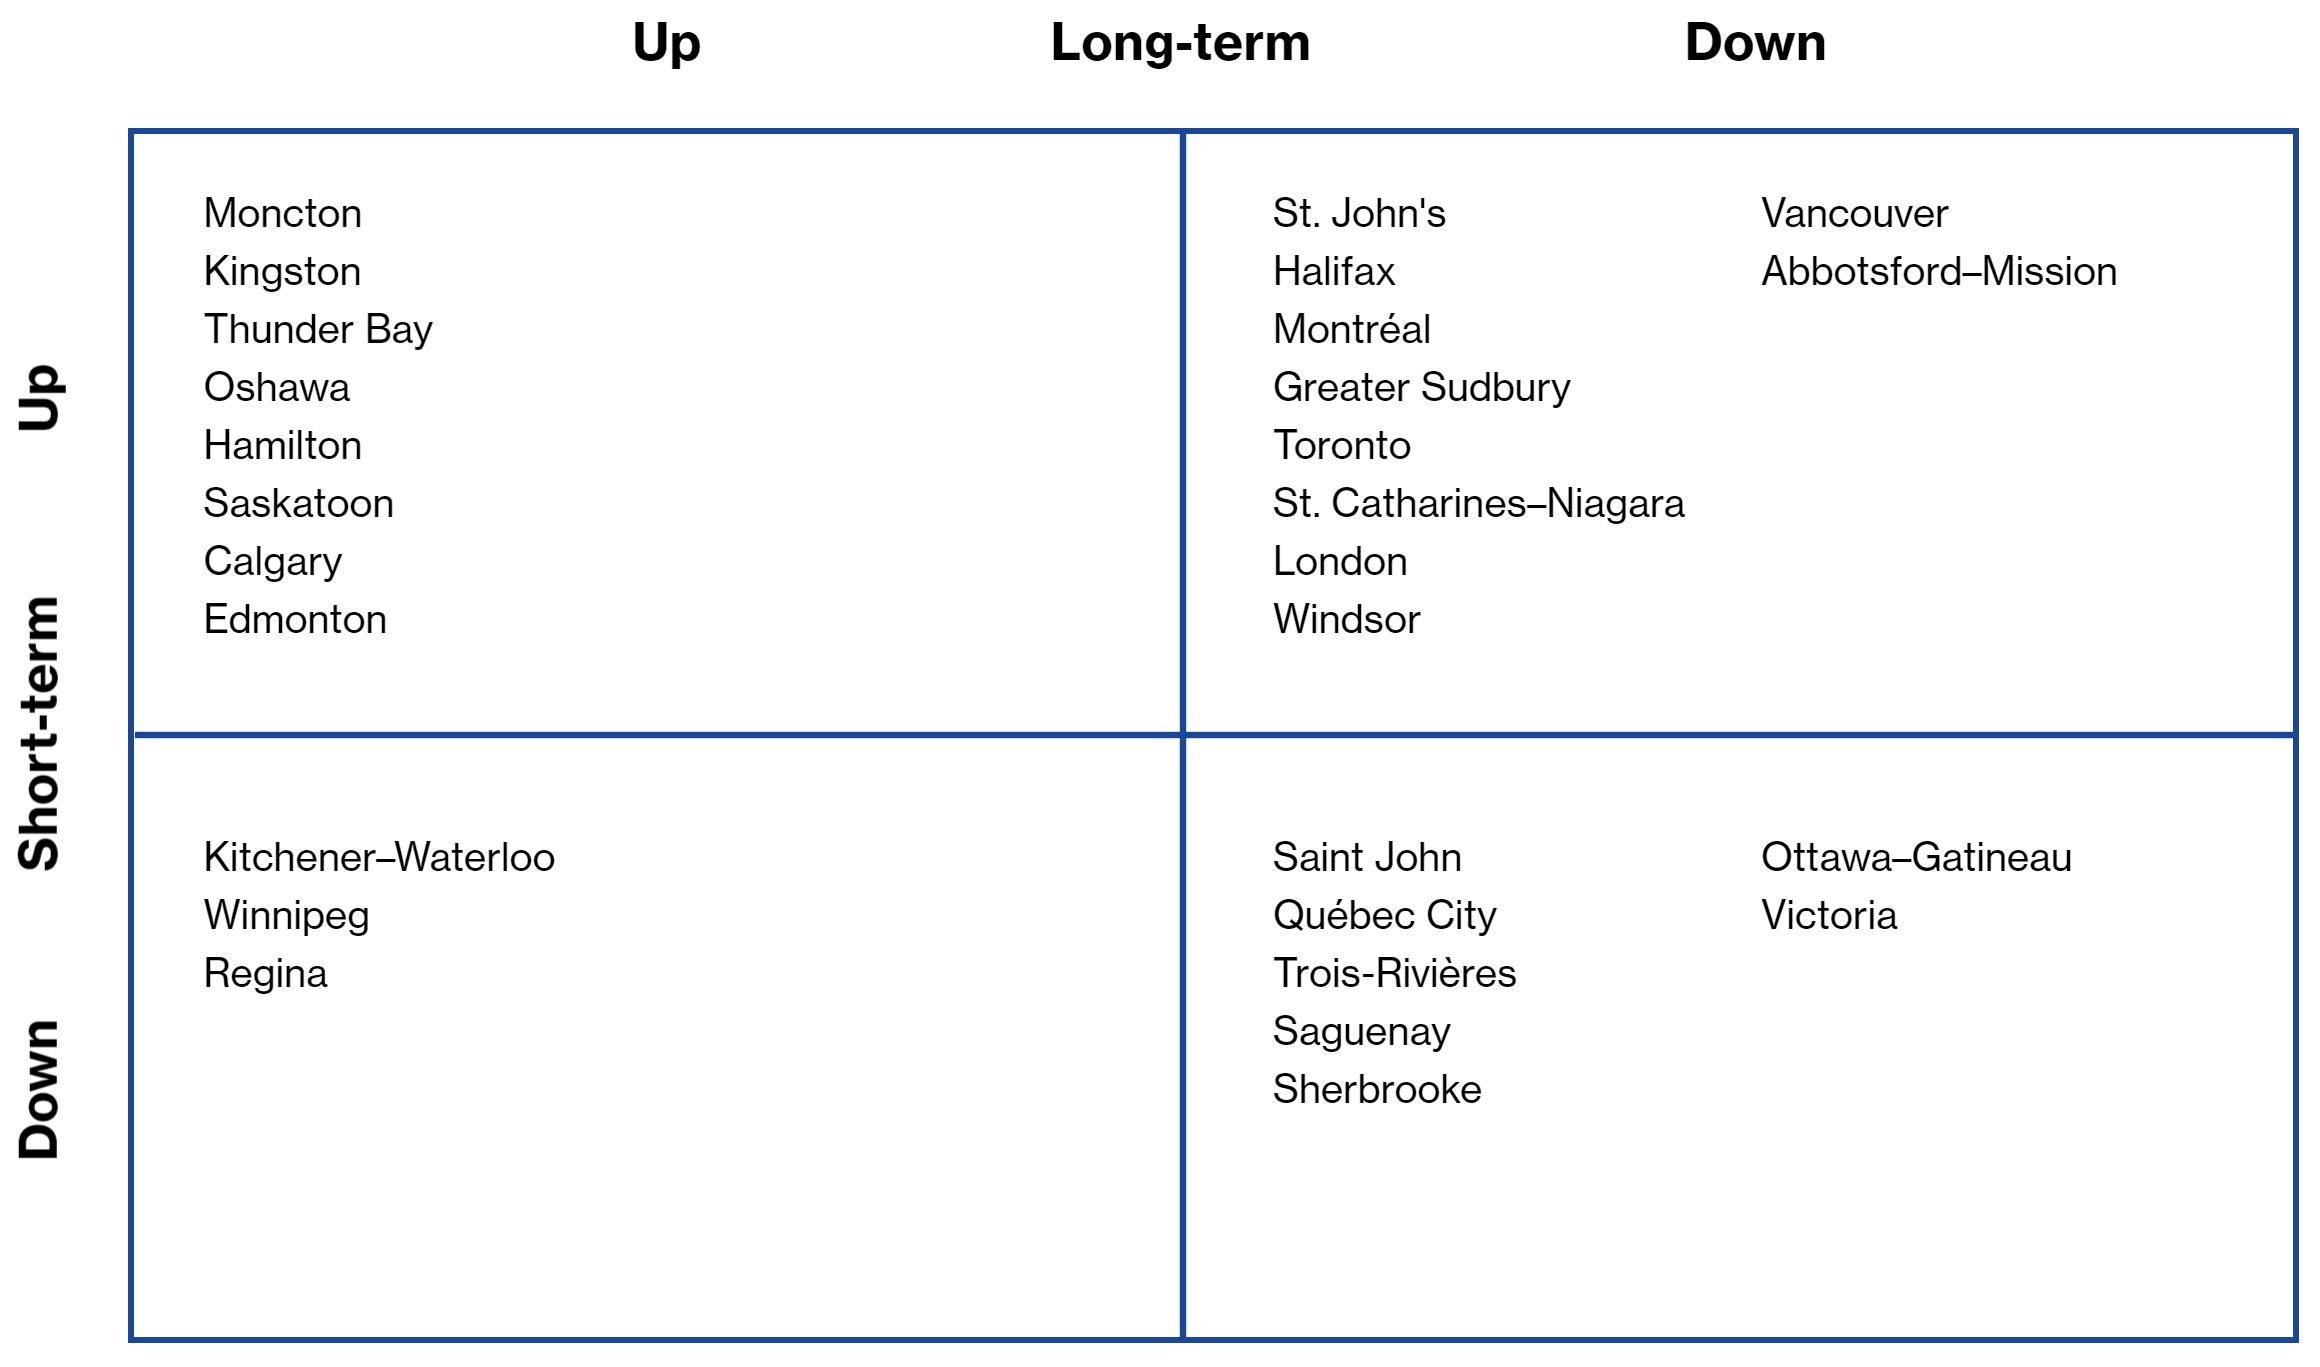
Note: Positioning in the quadrant indicates short- and long-term expectation for each CMA’s housing market. The best position would be in the Up-Up quadrant which shows positive prospects for both short- and long-term growth. The worst position would be the Down-Down quadrant.
Sources: Signal49 Research; CMHC Housing Market Information Portal
Abbotsford–Mission had the largest year-over-year percentage increase in starts in the latest month of data.
Metropolitan Housing Starts
| Expectations | ||||||||
| Year ago | 6 mon. MA | 3 mon. MA | July 2022 | Short-term* | Long-term** | |||
| St. John’s | 608 | 1,086 | 824 | 809 | + | – | ||
| Halifax | 3,360 | 4,111 | 6,629 | 5,865 | + | – | ||
| Saint John | 1,301 | 676 | 802 | 308 | – | – | ||
| Moncton | 1,561 | 1,988 | 3,204 | 2,566 | + | + | ||
| Québec CMA | 16,655 | 8,395 | 7,678 | 7,214 | – | – | ||
| Montréal | 30,528 | 28,270 | 31,979 | 24,933 | + | – | ||
| Trois-Rivières | 1,308 | 1,362 | 1,193 | 996 | – | – | ||
| Saguenay | 401 | 757 | 549 | 453 | – | – | ||
| Sherbrooke | 1,439 | 1,755 | 1,808 | 1,305 | – | – | ||
| Ottawa–Gatineau | 8,327 | 15,563 | 16,815 | 24,887 | – | – | ||
| Kingston | 572 | 699 | 1,199 | 724 | + | + | ||
| Greater Sudbury | 441 | 446 | 296 | 319 | + | – | ||
| Thunder Bay | 853 | 222 | 367 | 383 | + | + | ||
| Oshawa | 3,351 | 3,299 | 3,934 | 3,968 | + | + | ||
| Toronto | 46,294 | 42,892 | 42,822 | 39,105 | + | – | ||
| Hamilton | 2,909 | 3,266 | 2,862 | 2,312 | + | + | ||
| St. Catharines–Niagara | 2,232 | 2,671 | 2,171 | 1,479 | + | – | ||
| Kitchener–Waterloo | 6,001 | 3,772 | 4,601 | 4,885 | – | + | ||
| London | 6,752 | 3,254 | 4,036 | 3,345 | + | – | ||
| Windsor | 1,015 | 1,538 | 1,578 | 1,759 | + | – | ||
| Winnipeg | 4,873 | 5,554 | 5,431 | 5,127 | – | + | ||
| Regina | 659 | 989 | 1,119 | 987 | – | + | ||
| Saskatoon | 1,366 | 3,232 | 3,358 | 1,868 | + | + | ||
| Calgary | 16,886 | 19,026 | 21,831 | 22,479 | + | + | ||
| Edmonton | 11,288 | 15,154 | 16,331 | 15,955 | + | + | ||
| Vancouver | 24,444 | 23,717 | 26,732 | 23,318 | + | – | ||
| Victoria | 7,214 | 4,724 | 5,996 | 11,353 | – | – | ||
| Abbotsford–Mission | 502 | 1,634 | 1,630 | 1,951 | + | – | ||
Starts seasonally adjusted, annual rates.
*short-term expectations are based on residential permits data
**long-term expectations are based on demographic requirements
Sources: Signal49 Research; CMHC Housing Market Information Portal.
Disclaimer: Forecasts and research often involve numerous assumptions and data sources and are subject to inherent risks and uncertainties. This information is not intended as specific investment, accounting, legal, or tax advice.
Please note that our forecast was completed during Russia’s continuing invasion of Ukraine. Although the situation remains fluid, the core elements of the forecast presented in this briefing stand at publication. For Canada, we expect the largest implications of Russia’s actions will be on commodity and consumer prices. Visit signal49.ca for our latest insights. Signal49 Research reserves the right to adjust content as necessary.
The monthly Metropolitan Housing Starts publication provides the recent trends in housing starts for 28 metropolitan areas and expectations for starts over both the short and long term.
Any errors or omissions in fact or interpretation are the responsibility of Signal49 Research.