

Metropolitan Housing Starts
Number of CMAs With Negative Long-Term Expectations Continues to Rise
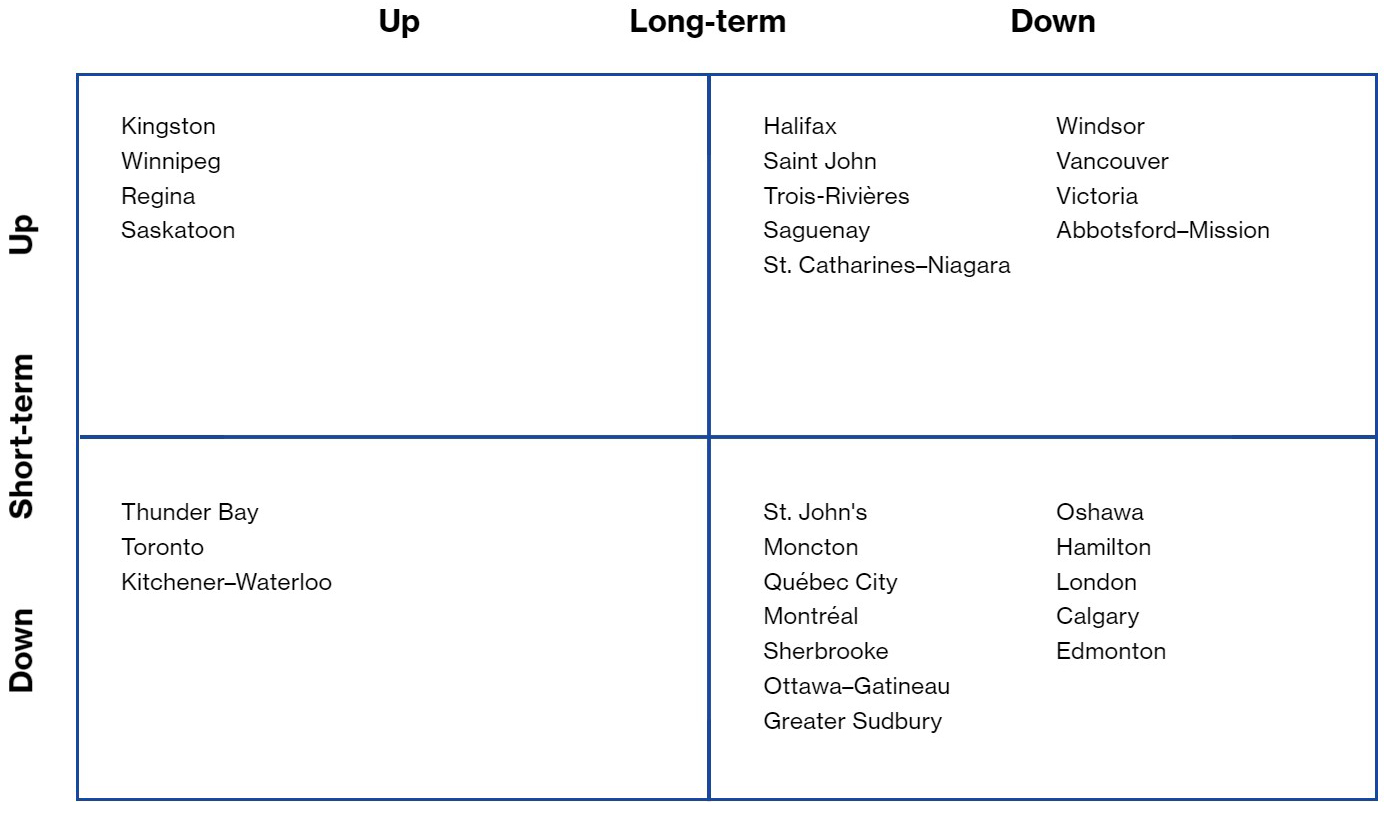
Key Findings
- Only four CMAs remained in the up-up quadrant in January, two less than the previous month.
- The number of CMAs in the down-down quadrant continues to grow. There are now more CMAs with negative long-term expectations than positive.
- The CMAs with the biggest year-over-year percentage decrease in housing starts in January were Kitchener–Waterloo, Saskatoon, Greater Sudbury, Moncton, and Calgary.
- Abbotsford–Mission had the largest year-over-year percentage increase in starts last month.
Expectations quadrant
*While residential permit data from the past six months suggest that starts will rise in Abbotsford–Mission in the short term, recent flooding in the area may make this impossible.
Note: Positioning in the quadrant indicates short- and long-term expectations for each CMA’s housing market. The best position would be in the up–up quadrant, which shows positive prospects for both short- and long-term growth. The worst position would be the down–down quadrant.
Sources: Signal49 Research; CMHC Housing Market Information Portal.
Abbotsford–Mission had the largest year-over-year percentage increase in starts last month.
Metropolitan Housing Starts
| Expectations | ||||||||
| Year ago | 6 mon. MA | 3 mon. MA | Jan. 2022 | Short-term* | Long-term** | |||
| St. John’s | 541 | 553 | 584 | 710 | – | – | ||
| Halifax | 4,635 | 4,868 | 6,020 | 5,760 | + | – | ||
| Saint John | 383 | 568 | 622 | 696 | + | – | ||
| Moncton | 1,415 | 1,794 | 1,938 | 597 | – | – | ||
| Québec CMA | 13,654 | 7,562 | 8,711 | 8,168 | – | – | ||
| Montréal | 36,894 | 29,106 | 28,499 | 26,456 | – | – | ||
| Trois-Rivières | 667 | 1,211 | 1,347 | 562 | + | – | ||
| Saguenay | 1,793 | 648 | 843 | 1,088 | + | – | ||
| Sherbrooke | 2,393 | 2,739 | 2,789 | 2,292 | – | – | ||
| Ottawa–Gatineau | 10,715 | 12,859 | 11,036 | 9,653 | + | – | ||
| Kingston | 1,521 | 1,654 | 2,761 | 887 | + | + | ||
| Greater Sudbury | 492 | 509 | 222 | 188 | + | – | ||
| Thunder Bay | 88 | 126 | 166 | 154 | – | + | ||
| Oshawa | 2,157 | 2,482 | 1,420 | 1,224 | – | – | ||
| Toronto | 36,774 | 42,653 | 40,789 | 21,714 | – | + | ||
| Hamilton | 2,418 | 3,696 | 3,987 | 1,577 | – | – | ||
| St. Catharines–Niagara | 2,422 | 2,681 | 2,232 | 2,066 | + | – | ||
| Kitchener–Waterloo | 10,358 | 4,402 | 3,635 | 1,414 | – | + | ||
| London | 3,939 | 4,045 | 3,951 | 5,144 | – | – | ||
| Windsor | 1,924 | 1,307 | 1,574 | 1,612 | + | – | ||
| Winnipeg | 7,644 | 5,740 | 5,713 | 6,328 | + | + | ||
| Regina | 616 | 1,033 | 1,261 | 755 | + | + | ||
| Saskatoon | 3,568 | 1,954 | 1,297 | 886 | + | + | ||
| Calgary | 14,355 | 14,434 | 15,682 | 7,546 | – | – | ||
| Edmonton | 10,944 | 13,103 | 11,992 | 11,776 | – | – | ||
| Vancouver | 17,713 | 20,909 | 22,568 | 22,192 | + | – | ||
| Victoria | 2,856 | 5,273 | 5,234 | 3,676 | + | – | ||
| Abbotsford–Mission | 997 | 1,293 | 1,630 | 2,046 | + | – | ||
Starts seasonally adjusted, annual rate.
*short-term expectations are based on residential permits data
**long-term expectations are based on demographic requirements
Sources: Signal49 Research; CMHC Housing Market Information Portal.
Disclaimer: Forecasts and research often involve numerous assumptions and data sources and are subject to inherent risks and uncertainties. This information is not intended as specific investment, accounting, legal, or tax advice.
The spread of the novel coronavirus disease (COVID-19) has created uncertainty in all global markets. We’re doing our best to provide timely updates, but information can fall out of date quickly. Visit signal49.ca for our latest insights. Signal49 Research reserves the right to adjust content as necessary.
About the Metropolitan Housing Starts
The monthly Metropolitan Housing Starts publication provides the recent trends in housing starts for 28 metropolitan areas and expectations for starts over both the short and long term.
Any errors or omissions in fact or interpretation are the responsibility of Signal49 Research.