

Metropolitan Housing Starts
Expectations for Housing Starts Largely Holding Course
Key findings
- There are only six census metropolitan areas (CMAs) with positive short- and long-term expectations this month, the same number as last month. These are the CMAs in the up-up quadrant.
- All of the Quebec CMAs have positive short-term expectations but negative long-term ones.
- The CMAs with the biggest year-over-year percentage decrease in housing starts in June were Halifax, Thunder Bay, St. Catharines–Niagara, Kitchener–Waterloo, and Sherbrooke.
- London had the largest year-over-year percentage increase in starts last month.
Expectations quadrant
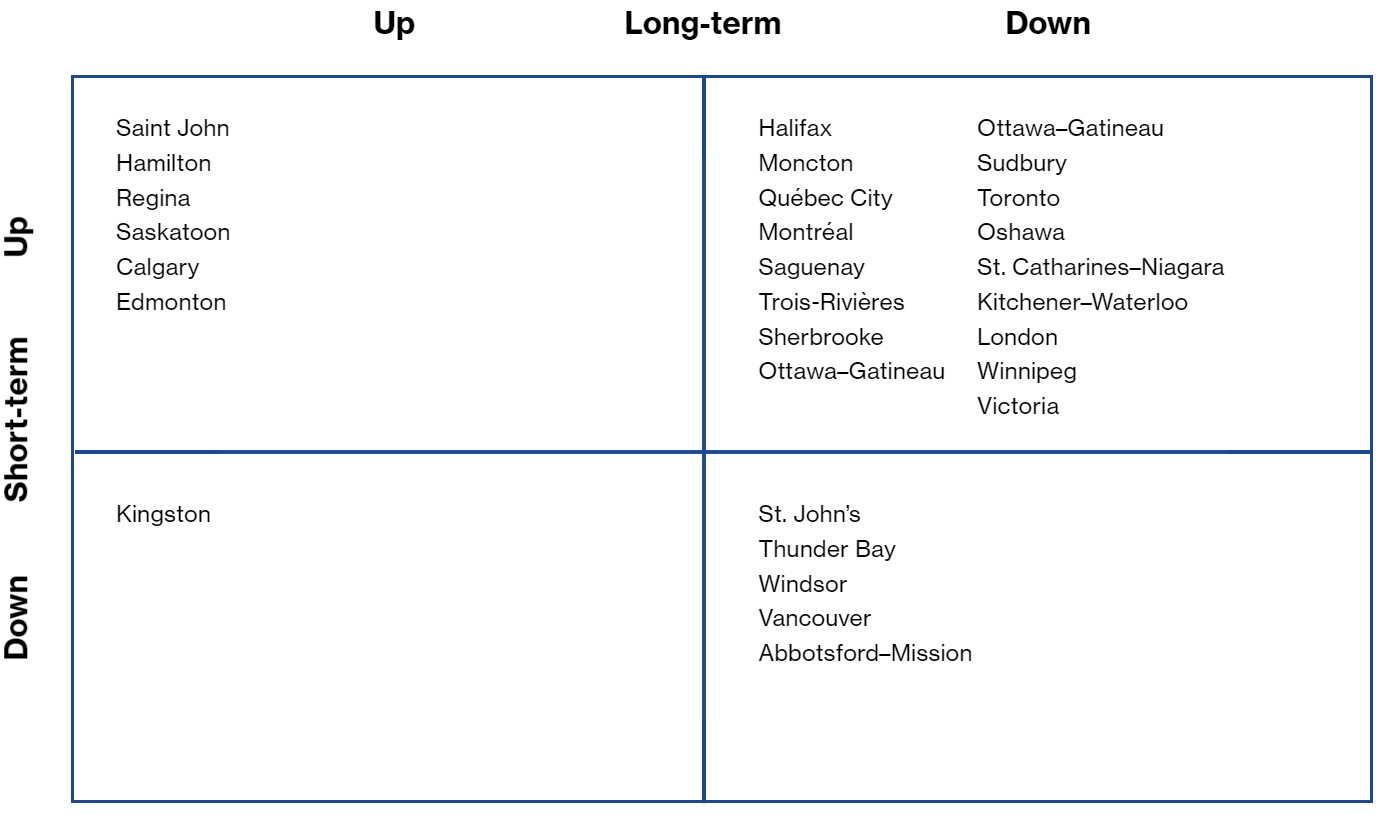
Note: Positioning in the quadrant indicates short- and long-term expectations for each CMA’s housing market. The best position would be in the up-up quadrant, which shows positive prospects for both short- and long-term growth. The worst position would be the down-down quadrant.
Sources: Signal49 Research; CMHC Housing Market Information Portal.
Every CMA in Quebec had positive short-term—but negative long-term—expectations.
Metropolitan Housing Starts
| Expectations | ||||||||
| Year ago | 6 mon. MA | 3 mon. MA | June 2021 | Short-term* | Long-term** | |||
| St. John’s | 331 | 657 | 735 | 583 | – | – | ||
| Halifax | 1,448 | 3,153 | 2,841 | 167 | + | – | ||
| Saint John | 471 | 452 | 581 | 368 | + | + | ||
| Moncton | 1,324 | 1,578 | 2,441 | 1,985 | + | – | ||
| Québec CMA | 11,328 | 10,037 | 11,912 | 16,974 | + | – | ||
| Montréal | 39,360 | 35,631 | 35,427 | 39,032 | + | – | ||
| Trois-Rivières | 993 | 990 | 1,000 | 1,274 | + | – | ||
| Saguenay | 482 | 777 | 701 | 657 | + | – | ||
| Sherbrooke | 4,123 | 2,867 | 2,608 | 2,616 | + | – | ||
| Ottawa–Gatineau | 10,870 | 14,472 | 16,151 | 8,868 | + | – | ||
| Kingston | 782 | 1,174 | 617 | 563 | – | + | ||
| Greater Sudbury | 171 | 1,179 | 662 | 416 | + | – | ||
| Thunder Bay | 352 | 419 | 377 | 83 | – | – | ||
| Oshawa | 1,624 | 5,025 | 5,926 | 4,769 | + | – | ||
| Toronto | 39,733 | 37,552 | 33,414 | 35,829 | + | – | ||
| Hamilton | 2,725 | 4,641 | 5,212 | 5,005 | + | + | ||
| St. Catharines–Niagara | 4,399 | 2,668 | 2,559 | 1,727 | + | – | ||
| Kitchener–Waterloo | 7,383 | 6,066 | 6,801 | 3,096 | + | – | ||
| London | 2,642 | 7,058 | 8,522 | 10,513 | + | – | ||
| Windsor | 1,835 | 1,716 | 2,200 | 1,725 | – | – | ||
| Winnipeg | 6,385 | 5,846 | 6,053 | 8,048 | + | – | ||
| Regina | 272 | 954 | 865 | 958 | + | + | ||
| Saskatoon | 1,919 | 3,430 | 3,553 | 2,121 | + | + | ||
| Calgary | 4,914 | 14,026 | 15,718 | 13,607 | + | + | ||
| Edmonton | 6,990 | 12,109 | 12,953 | 12,337 | + | + | ||
| Vancouver | 23,487 | 30,844 | 31,544 | 44,961 | – | – | ||
| Victoria | 2,338 | 3,778 | 3,539 | 4,156 | + | – | ||
| Abbotsford–Mission | 589 | 1,129 | 986 | 1,696 | – | – | ||
Starts seasonally adjusted, annual rates.
*short-term expectations are based on residential permits data
**long-term expectations are based on demographic requirements, as well current conditions
Sources: Signal49 Research; CMHC Housing Market Information Portal.
The monthly Metropolitan Housing Starts publication provides the recent trends in housing starts for 28 metropolitan areas and expectations for starts over both the short and long term.
Any errors or omissions in fact or interpretation are the responsibility of Signal49 Research.
Disclaimer: Forecasts and research often involve numerous assumptions and data sources and are subject to inherent risks and uncertainties. This information is not intended as specific investment, accounting, legal, or tax advice.