

Metropolitan Housing Starts
Positive Expectations Getting Harder to Come By
Key Findings
- There are just three CMAs in the up-up quadrant this month—one fewer than the previous month.
- Expectations for the long-term are positive in only 25 per cent of the CMAs covered here. In nearly 36 per cent (10 of 28), expectations are negative for both the short and long terms.
- The CMAs with the biggest year-over-year percentage decrease in housing starts in February were Oshawa, London, Hamilton, Regina, and Montréal.
- Saguenay had the largest year-over-year percentage increase in starts in February.
Expectations quadrant
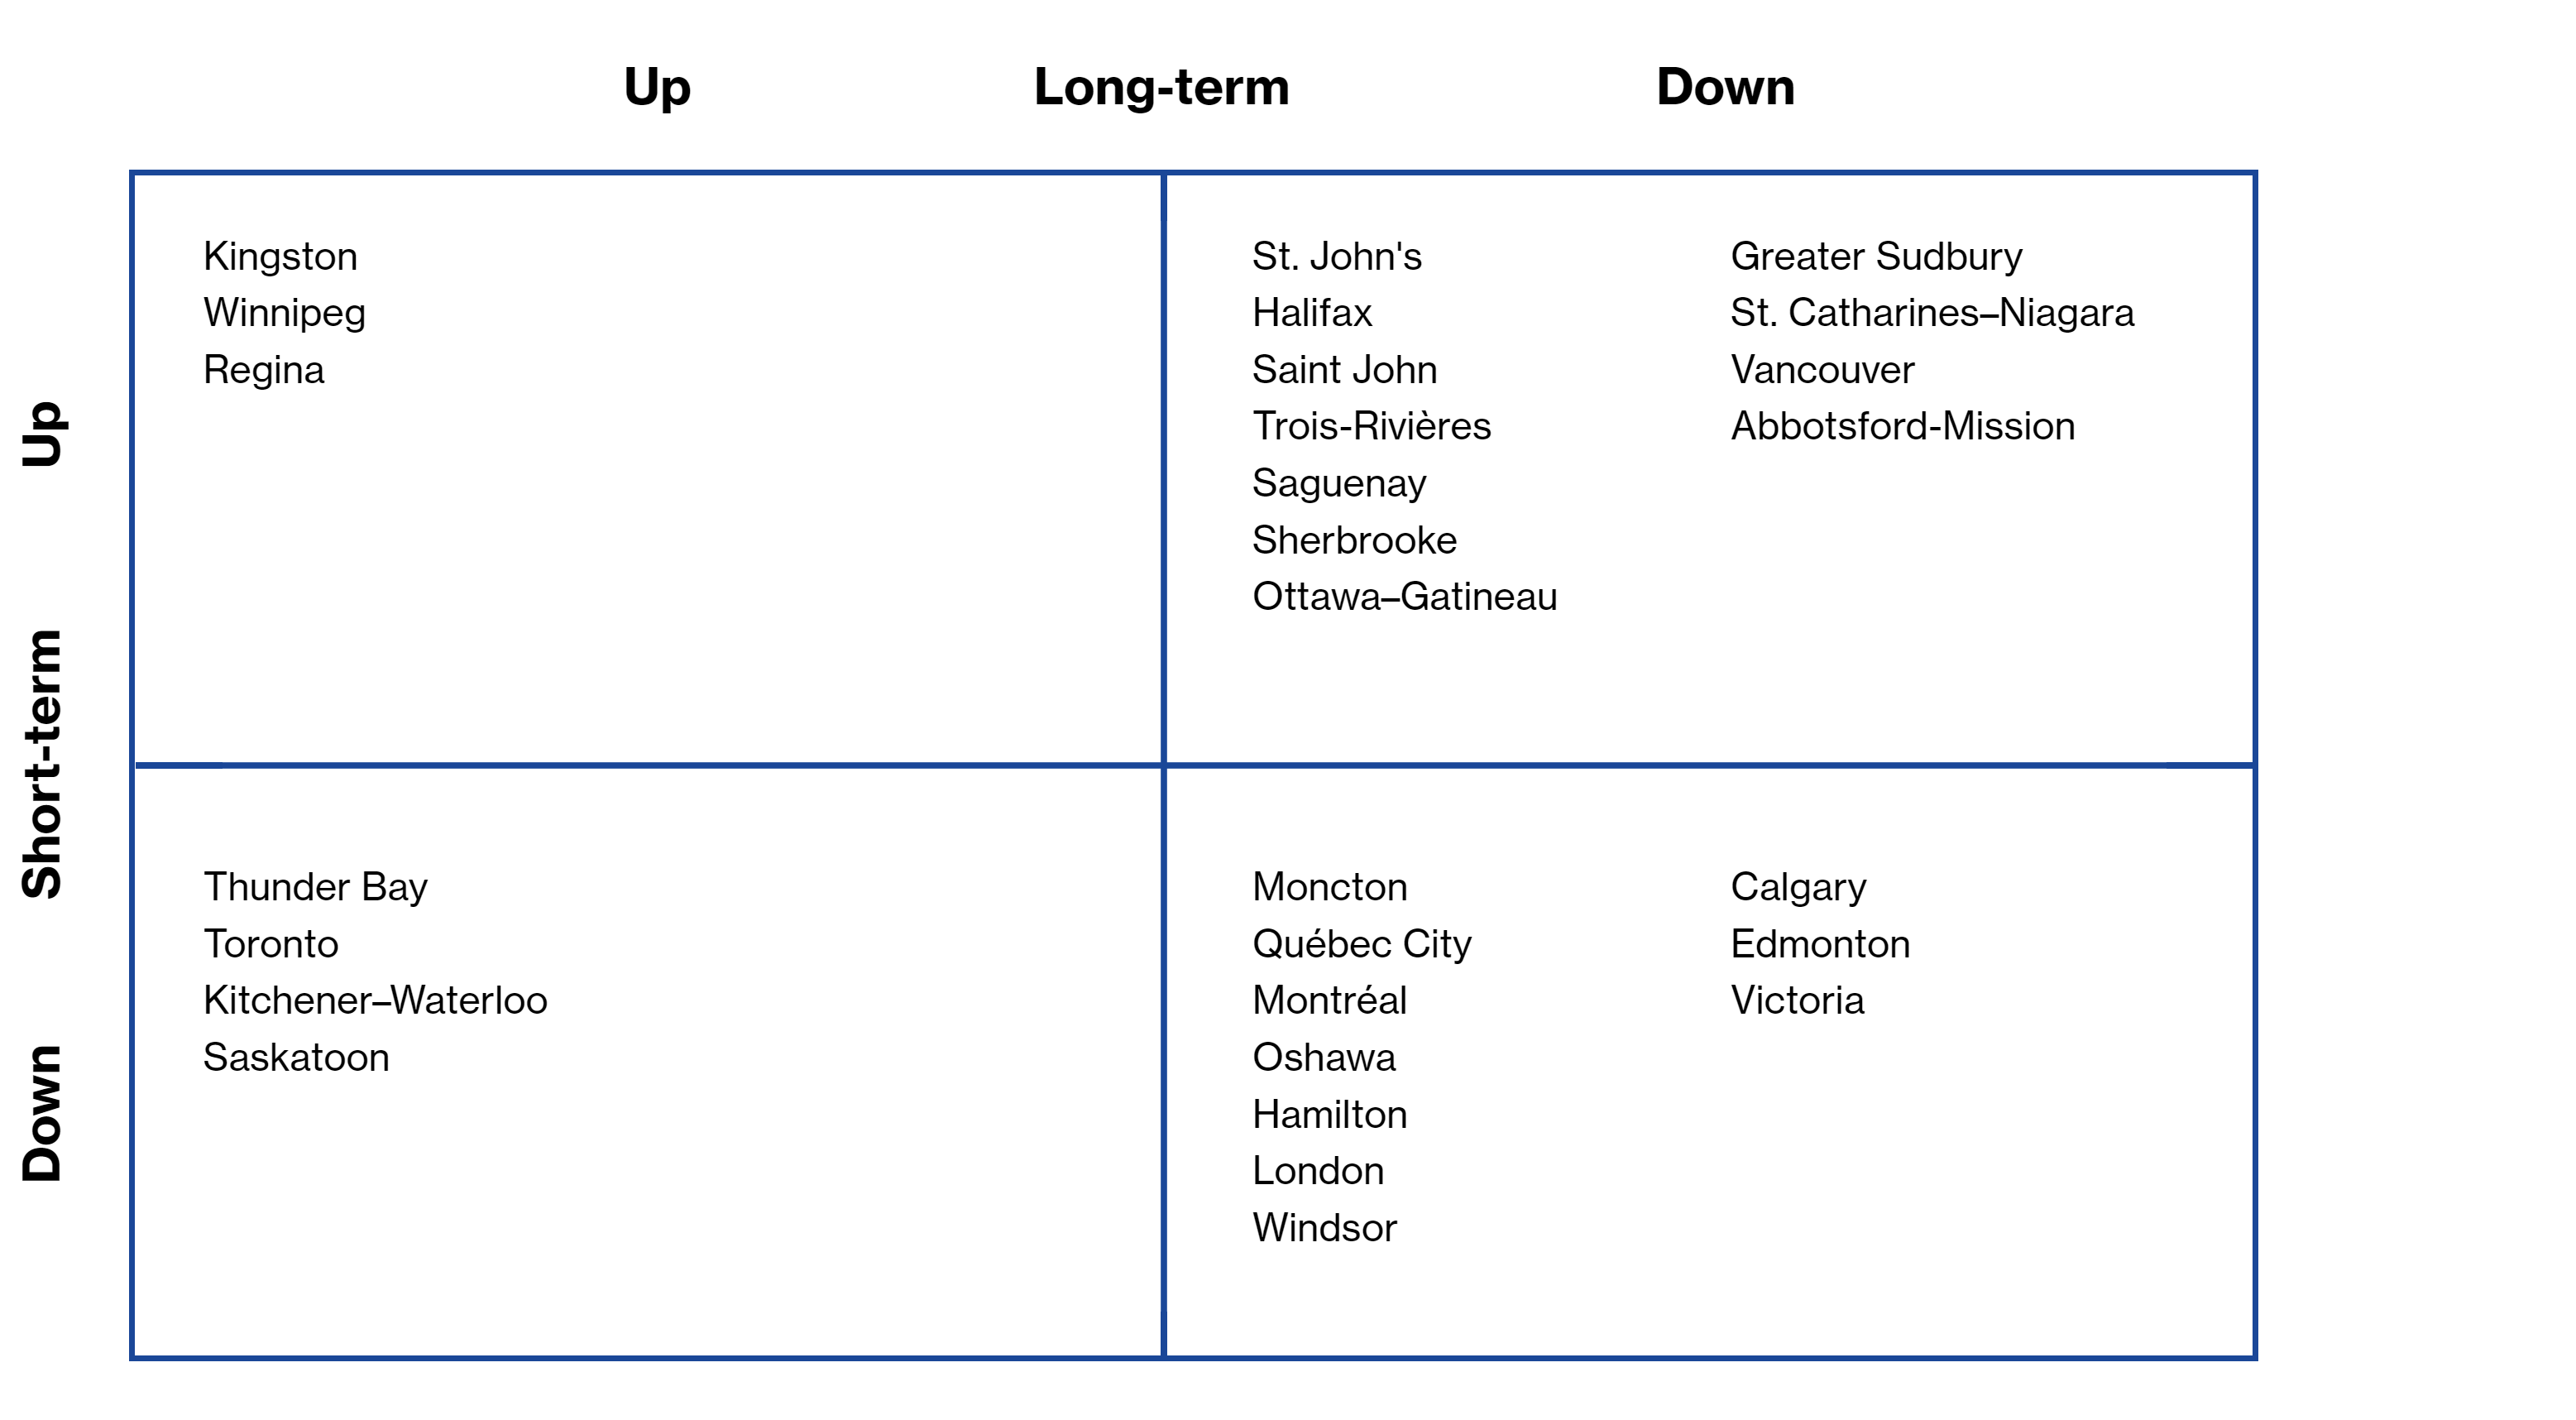
*While residential permit data from the past six months suggest that starts will rise in Abbotsford–Mission in the short term, recent flooding in the area may make this impossible.
Note: Positioning in the quadrant indicates short- and long-term expectations for each CMA’s housing market. The best position would be in the up–up quadrant, which shows positive prospects for both short- and long-term growth. The worst position would be the down–down quadrant.
Sources: Signal49 Research; CMHC Housing Market Information Portal.
Saguenay had the largest year-over-year percentage increase in starts in February.
Metropolitan Housing Starts
| Year ago | 6 mon. MA | 3 mon. MA | Nov 2021 | Expectations Short-term* |
Expectations Long-term** |
|
|---|---|---|---|---|---|---|
| St. John’s | 405 | 665 | 868 | 1,056 | + | – |
| Halifax | 3,097 | 5,105 | 4,836 | 1,840 | + | – |
| Saint John | 318 | 572 | 670 | 327 | + | – |
| Moncton | 431 | 1,418 | 910 | 209 | – | – |
| Québec CMA | 3,744 | 8,061 | 7,117 | 5,130 | – | – |
| Montréal | 39,909 | 27,380 | 21,863 | 16,142 | – | – |
| Trois-Rivières | 484 | 1,311 | 1,139 | 1,014 | + | – |
| Saguenay | 279 | 840 | 1,121 | 1,262 | + | – |
| Sherbrooke | 3,247 | 2,773 | 2,544 | 2,029 | + | – |
| Ottawa–Gatineau | 12,655 | 12,980 | 8,669 | 11,698 | + | – |
| Kingston | 577 | 1,614 | 629 | 252 | + | + |
| Greater Sudbury | 141 | 517 | 163 | 123 | + | – |
| Thunder Bay | 95 | 131 | 138 | 136 | – | + |
| Oshawa | 4,448 | 2,094 | 999 | 845 | – | – |
| Toronto | 24,380 | 45,979 | 39,308 | 65,763 | – | + |
| Hamilton | 7,973 | 2,773 | 2,701 | 2,630 | – | – |
| St. Catharines–Niagara | 2,095 | 2,635 | 1,978 | 1,872 | + | – |
| Kitchener–Waterloo | 1,258 | 3,866 | 3,315 | 2,264 | – | + |
| London | 9,152 | 3,655 | 3,520 | 2,277 | – | – |
| Windsor | 968 | 1,215 | 1,252 | 931 | – | – |
| Winnipeg | 5,743 | 5,923 | 6,403 | 6,814 | + | + |
| Regina | 1,258 | 1,013 | 760 | 486 | + | + |
| Saskatoon | 1,753 | 2,229 | 1,805 | 2,797 | – | + |
| Calgary | 8,652 | 14,792 | 12,035 | 14,974 | – | – |
| Edmonton | 12,489 | 12,431 | 11,706 | 10,552 | – | – |
| Vancouver | 27,692 | 20,055 | 22,021 | 17,168 | + | – |
| Victoria | 2,036 | 4,940 | 5,491 | 5,049 | – | – |
| Abbotsford–Mission | 2,009 | 1,443 | 1,900 | 1,465 | + | – |
Starts seasonally adjusted, annual rates.
*short-term expectations are based on residential permits data
**long-term expectations are based on demographic requirements
Sources: Signal49 Research; CMHC Housing Market Information Portal.
The monthly Metropolitan Housing Starts publication provides the recent trends in housing starts for 28 metropolitan areas and expectations for starts over both the short and long term.
Any errors or omissions in fact or interpretation are the responsibility of Signal49 Research.
Disclaimer: Forecasts and research often involve numerous assumptions and data sources and are subject to inherent risks and uncertainties. This information is not intended as specific investment, accounting, legal, or tax advice.