

Another Electric Month for Resale Markets
Metropolitan Resale Snapshot
- Canada’s existing housing markets continued red-hot in March, as rising listings allowed higher sales volumes in many markets. Interest rates remain low, and homebuyers generally want more living space and can look in secondary markets, now that many former commuters work from home.
- Sales rose in 22 of our 30 markets during March, with gains exceeding 5 per cent in 20 areas. Transactions were above their year-earlier levels in all 30 markets, partly because COVID-19 restrictions limited March 2020 activity. While listings rose in 28 of our 30 markets during March—including 20 where the gain was at least 5 per cent—and exceeded their year-earlier levels in all 30 markets, further supply additions could be needed to fulfill homebuyer demand.
- Most markets continue to be extremely tight; 26 remain in sellers’ territory and prices rose at least 20 per cent year-over-year in 21 areas. Further strong price growth appears likely in the near term, since sales rose faster (or fell less) than listings in 13 of our 30 markets last month.
- Sales rose in Vancouver and Calgary during March, but eased in Toronto and fell more substantially in Montréal. Vancouver’s transactions were at a record high, while those in Toronto were just below February 2021’s all-time peak. Calgary’s volumes are also surging, and are near their 2006 high. Montréal’s have now eased in five of the past six months, perhaps limited by previously scarce listings.
- Listings rose in Vancouver, Calgary, Toronto, and Montréal during March. Vancouver’s gain exceeded 20 per cent. Those in Calgary and Montréal were lower, but still in double digits. Toronto listings were largely flat. All four cities’ listings are now above year-earlier levels. Sellers’ conditions persist in Vancouver, Toronto, and Montréal. Calgary’s conditions are balanced.
- Prices rose in all four of Vancouver, Calgary, Toronto, and Montréal last month. Especially large monthly increases in the latter two cities lifted their year-over-year gains above 20 per cent. Vancouver and Calgary had smaller—but still double-digit—annual increases.
Recent market performance
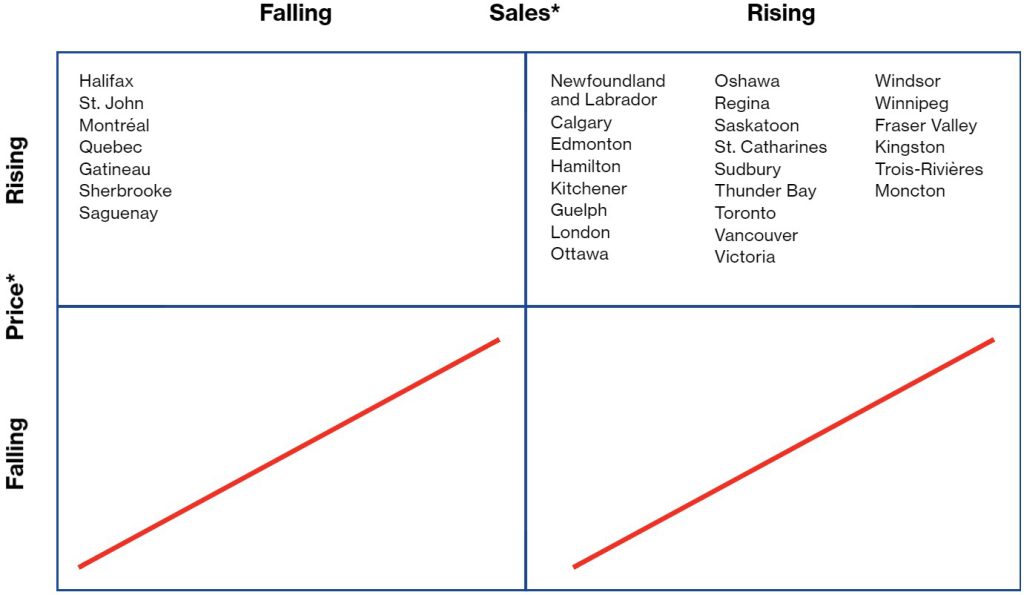
*Average month-to-month change during latest three months
Forecast of near-term price growth
(year-over-year)
7% +
Victoria, Vancouver, Fraser Valley, Calgary, Edmonton, Winnipeg, Thunder Bay, Sudbury, Toronto, Oshawa, Hamilton, St. Catharines, Kitchener, Guelph, London, Windsor, Kingston, Ottawa, Gatineau, Montréal, Québec City, Sherbrooke, Trois-Rivières, Saguenay, Saint John, Moncton, Halifax, Newfoundland and Labrador
5–6.9%
Regina, Saskatoon
3–4.9%
None
0–2.9%
None
Falling
None
Further supply could be needed to fulfill homebuyer demand.
Resale indicators for March 2021
| Sales-to-new-listings ratio | ||||||||
| Market1 | Market classification | Sales (#)2 | Listings (#) | Level | Balanced market range3 |
Price ($) |
||
| Victoria | Sellers’ | 11,484 | 12,072 | 0.924 | 0.483–0.766 | 885,846 | ||
| m/m % | –0.3 | –7.5 | 0.1 | |||||
| y/y % | 93.3 | 30.8 | 19.8 | |||||
| Vancouver | Sellers’ | 62,688 | 82,524 | 0.768 | 0.435–0.718 | 1,167,367 | ||
| 22.2 | 21.1 | 1.9 | ||||||
| 132.0 | 81.8 | 10.5 | ||||||
| Fraser Valley4 | Sellers’ | 34,068 | 43,428 | 0.791 | 0.439–0.711 | 994,286 | ||
| –4.7 | 1.2 | 4.6 | ||||||
| 139.8 | 93.0 | 30.8 | ||||||
| Calgary | Balanced | 39,708 | 58,128 | 0.718 | 0.462–0.725 | 508,573 | ||
| 7.6 | 18.9 | 3.5 | ||||||
| 147.3 | 99.8 | 15.6 | ||||||
| Edmonton | Balanced | 32,652 | 47,172 | 0.693 | 0.450–0.710 | 402,563 | ||
| 9.7 | 11.4 | 3.5 | ||||||
| 105.5 | 57.0 | 14.7 | ||||||
| Regina | Balanced | 5,568 | 8,244 | 0.711 | 0.489–0.752 | 329,027 | ||
| 13.7 | 22.0 | 9.7 | ||||||
| 64.0 | 47.4 | 4.7 | ||||||
| Saskatoon | Sellers’ | 9,768 | 12,384 | 0.751 | 0.424–0.678 | 343,514 | ||
| 17.0 | 3.6 | 0.5 | ||||||
| 94.7 | 43.9 | 5.2 | ||||||
| Winnipeg | Sellers’ | 21,480 | 23,076 | 0.930 | 0.446–0.788 | 346,619 | ||
| 6.2 | 3.1 | 2.9 | ||||||
| 71.8 | 12.2 | 14.4 | ||||||
| Thunder Bay | Sellers’ | 2,772 | 3,204 | 0.854 | 0.495–0.756 | 287,738 | ||
| 5.0 | 1.5 | –5.7 | ||||||
| 61.5 | 30.9 | 23.6 | ||||||
| Sudbury | Sellers’ | 4,320 | 4,620 | 0.942 | 0.342–0.669 | 372,842 | ||
| 18.8 | 21.8 | –0.7 | ||||||
| 79.1 | 54.6 | 20.1 | ||||||
| Toronto | Sellers’ | 162,792 | 230,136 | 0.717 | 0.464–0.686 | 1,085,071 | ||
| –0.5 | 0.9 | 4.2 | ||||||
| 103.2 | 63.3 | 21.7 | ||||||
| Oshawa | Sellers’ | 21,840 | 26,904 | 0.813 | 0.477–0.748 | 880,986 | ||
| 6.6 | –4.4 | 0.8 | ||||||
| 96.1 | 51.7 | 36.6 | ||||||
| Hamilton | Sellers’ | 22,032 | 25,476 | 0.860 | 0.433–0.797 | 851,464 | ||
| 11.4 | 4.0 | 2.2 | ||||||
| 78.8 | 53.2 | 31.3 | ||||||
| St. Catharines | Sellers’ | 5,628 | 7,368 | 0.782 | 0.395–0.715 | 699,392 | ||
| 15.0 | 37.7 | –7.1 | ||||||
| 98.7 | 54.3 | 34.4 | ||||||
| Kitchener | Sellers’ | 15,708 | 18,396 | 0.841 | 0.482–0.763 | 751,823 | ||
| 28.5 | 18.5 | 0.0 | ||||||
| 87.0 | 61.2 | 34.0 | ||||||
| Guelph | Sellers’ | 5,496 | 6,012 | 0.901 | 0.506–0.836 | 784,558 | ||
| 11.2 | 6.4 | 1.5 | ||||||
| 68.4 | 44.4 | 31.1 | ||||||
| London | Sellers’ | 14,400 | 15,432 | 0.910 | 0.417–0.709 | 622,051 | ||
| 7.5 | 6.1 | 3.5 | ||||||
| 65.1 | 26.1 | 43.3 | ||||||
| Windsor | Sellers’ | 9,396 | 10,944 | 0.871 | 0.436–0.686 | 509,201 | ||
| 1.7 | 3.6 | 9.1 | ||||||
| 52.0 | 13.2 | 46.3 | ||||||
| Kingston | Sellers’ | 6,336 | 6,936 | 0.895 | 0.359–0.667 | 575,340 | ||
| 22.8 | 0.2 | –2.9 | ||||||
| 64.5 | 23.8 | 37.4 | ||||||
| Ottawa | Sellers’ | 27,216 | 27,936 | 0.948 | 0.411–0.713 | 651,887 | ||
| 9.0 | 8.6 | 3.1 | ||||||
| 60.1 | 40.6 | 30.8 | ||||||
| Gatineau | Sellers’ | 7,154 | 7,410 | 0.926 | 0.440–0.743 | 380,068 | ||
| –3.0 | 8.0 | 3.1 | ||||||
| 18.2 | 28.9 | 30.4 | ||||||
| Montréal | Sellers’ | 57,361 | 74,612 | 0.780 | 0.475–0.718 | 537,881 | ||
| –6.2 | 14.9 | 4.8 | ||||||
| 9.4 | 40.6 | 26.6 | ||||||
| Québec City | Balanced | 11,515 | 16,457 | 0.708 | 0.496–0.768 | 322,009 | ||
| –2.9 | 30.3 | 0.2 | ||||||
| 18.8 | 53.9 | 12.6 | ||||||
| Sherbrooke | Sellers’ | 2,802 | 3,196 | 0.891 | 0.446–0.753 | 369,036 | ||
| 8.4 | 9.0 | –3.9 | ||||||
| 32.6 | 42.1 | 39.6 | ||||||
| Trois-Rivières | Sellers’ | 1,727 | 2,174 | 0.811 | 0.473–0.797 | 220,687 | ||
| 19.4 | 30.6 | –1.2 | ||||||
| 22.0 | 75.7 | 24.4 | ||||||
| Saguenay | Sellers’ | 1,859 | 2,235 | 0.837 | 0.426–0.733 | 230,102 | ||
| –6.0 | 16.2 | 6.8 | ||||||
| 46.9 | 47.1 | 27.9 | ||||||
| Saint John | Sellers’ | 3,192 | 3,792 | 0.812 | 0.356–0.631 | 265,095 | ||
| –3.3 | 29.0 | 20.6 | ||||||
| 26.7 | 60.4 | |||||||
The monthly Metro Resale Snapshot provides an overview of the existing home market for 30 areas and expectations for existing home price growth over the short term.
Any errors or omissions in fact or interpretation are the responsibility of Signal49 Research.
Disclaimer: Forecasts and research often involve numerous assumptions and data sources and are subject to inherent risks and uncertainties. This information is not intended as specific investment, accounting, legal, or tax advice.