

Markets Continue to Moderate in July
Metropolitan Resale Snapshot
- Canada’s existing housing markets calmed down further in July. Sales and listings both dropped in most areas and price growth continued to cool. Falling sales nonetheless left July volumes strong by past standards, while dwindling listings kept markets tight. Low interest rates remain a spur.
- Sales fell in 23 of our 30 areas in July, with losses above 5 per cent in 14 places. Such weakness is ongoing: Sales have fallen on a three-month average basis in all 30 of our markets. This erosion cut transactions below their year-earlier levels in 22 of our 30 markets in July. This is the largest number of areas to report such a decline since the pandemic’s height in spring 2020.
- Listings were also cooler; they declined in 25 of our 30 markets during July, including 21 areas where the drop was at least 5 per cent. This softening put listings below year-earlier levels in 21 markets.
- Ongoing market recalibration is demonstrated by an easing sales-to-listings ratio in 14 areas during July, as well as monthly price drops in 22 areas. Many markets nonetheless remain tight, with 19 of our 30 areas in sellers’ territory and prices up at least 20 per cent year-over-year in 12 areas.
- July sales fell in each of Vancouver, Calgary, Toronto, and Montréal. This was the fourth consecutive sales drop in Vancouver and Toronto, the third straight for Calgary, and the second in the last three months for Montréal. Sales in Toronto and Vancouver were the lowest since last June and last July, respectively. Montréal’s sales have slowed sharply this year, while Calgary’s are pulling back from spring highs.
- Listings fell in Vancouver, Calgary, Toronto, and Montréal during July. All but Toronto saw double-digit declines. Listings were below year-earlier levels in Vancouver, Toronto and Montréal, but higher in Calgary. Vancouver and Calgary are now balanced markets, while Toronto and Montréal are in a sellers’ state.
- Toronto’s average price rose in July, but prices fell in Vancouver and Montréal. Calgary’s was flat. Year-over-year price growth is diminishing in all four cities, but remains in double-digits in all except Calgary. Montréal’s 15.6 per cent rise was last month’s fastest annual growth.
Recent market performance
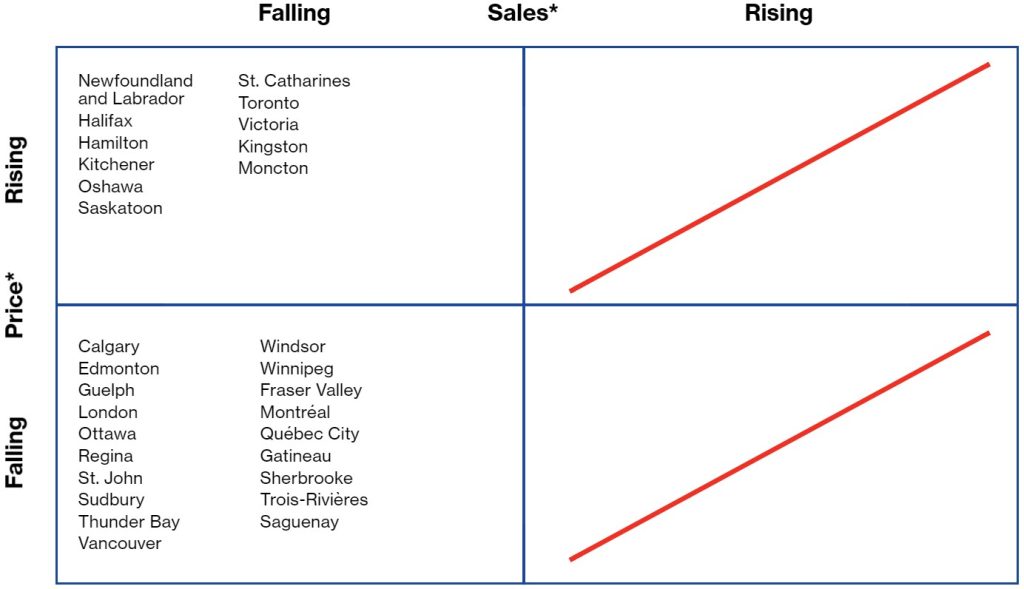
*Average month-to-month change during latest three months
Forecast of near-term price growth
(year-over-year)
7% +
Victoria, Fraser Valley, Thunder Bay, Sudbury, Toronto, Oshawa, Hamilton, St. Catharines, Kitchener, Guelph, London, Windsor, Kingston, Ottawa, Gatineau, Montréal, Sherbrooke, Trois-Rivières, Saint John, Moncton, Halifax, Newfoundland and Labrador
5–6.9%
Vancouver, Calgary, Edmonton, Regina, Québec City, Saguenay
3–4.9%
Saskatoon, Winnipeg
0–2.9%
None
Falling
None
Three-month average sales volumes have fallen in all 30 of our markets.
Resale indicators for July 2021
| Sales-to-new-listings ratio | ||||||||
| Market1 | Market classification | Sales (#)2 | Listings (#) | Level | Balanced market range3 |
Price ($) |
||
| Victoria | Sellers’ | 8,592 | 10,536 | 0.817 | 0.484–0.770 | 884,330 | ||
| m/m % | 4.1 | –7.5 | 0.5 | |||||
| y/y % | –10.1 | –25.8 | 8.7 | |||||
| Vancouver | Balanced | 39,036 | 53,508 | 0.679 | 0.437–0.718 | 1,171,572 | ||
| –0.4 | –16.1 | –1.3 | ||||||
| 14.8 | –12.6 | 10.3 | ||||||
| Fraser Valley4 | Sellers’ | 21,936 | 26,148 | 0.827 | 0.441–0.715 | 971,991 | ||
| 2.0 | –15.7 | –0.1 | ||||||
| 6.2 | –18.3 | 18.0 | ||||||
| Calgary | Balanced | 33,144 | 46,824 | 0.721 | 0.464–0.727 | 496,178 | ||
| –7.9 | –10.6 | –0.2 | ||||||
| 33.8 | 2.3 | 5.8 | ||||||
| Edmonton | Balanced | 24,096 | 41,880 | 0.572 | 0.451–0.710 | 391,218 | ||
| –11.4 | –9.9 | –1.8 | ||||||
| 10.1 | 3.5 | 5.1 | ||||||
| Regina | Balanced | 4,392 | 6,924 | 0.636 | 0.490–0.752 | 319,315 | ||
| –1.9 | –3.2 | –1.5 | ||||||
| –4.7 | 0.3 | 5.4 | ||||||
| Saskatoon | Balanced | 6,384 | 11,208 | 0.590 | 0.425–0.678 | 346,040 | ||
| –14.9 | 4.6 | –1.2 | ||||||
| –10.6 | –10.1 | 3.4 | ||||||
| Winnipeg | Balanced | 16,548 | 21,588 | 0.765 | 0.448–0.791 | 323,863 | ||
| 9.4 | 7.9 | –8.6 | ||||||
| 5.0 | 3.3 | 0.0 | ||||||
| Thunder Bay | Sellers’ | 2,088 | 2,664 | 0.812 | 0.497–0.760 | 289,570 | ||
| –3.3 | 4.7 | –1.2 | ||||||
| –13.9 | 10.4 | 12.0 | ||||||
| Sudbury | Sellers’ | 2,616 | 3,096 | 0.798 | 0.343–0.675 | 357,919 | ||
| –8.8 | –15.4 | –8.1 | ||||||
| –18.7 | –8.5 | 16.4 | ||||||
| Toronto | Sellers’ | 105,924 | 148,908 | 0.704 | 0.465–0.688 | 1,071,405 | ||
| –2.0 | –8.1 | 0.9 | ||||||
| –7.0 | –20.7 | 12.6 | ||||||
| Oshawa | Sellers’ | 11,664 | 13,524 | 0.874 | 0.479–0.753 | 908,337 | ||
| –9.7 | –11.7 | 1.4 | ||||||
| –23.9 | –24.4 | 28.2 | ||||||
| Hamilton | Balanced | 13,320 | 17,256 | 0.782 | 0.435–0.799 | 842,915 | ||
| –5.4 | –8.9 | –1.2 | ||||||
| –22.8 | –20.7 | 21.8 | ||||||
| St. Catharines | Sellers’ | 3,684 | 5,052 | 0.771 | 0.396–0.717 | 714,233 | ||
| –6.7 | –6.7 | 0.8 | ||||||
| –24.4 | –5.6 | 20.8 | ||||||
| Kitchener | Sellers’ | 9,780 | 10,980 | 0.890 | 0.483–0.768 | 774,304 | ||
| 0.4 | –11.6 | 3.1 | ||||||
| –11.9 | –17.9 | 21.4 | ||||||
| Guelph | Balanced | 3,252 | 4,332 | 0.773 | 0.508–0.837 | 802,250 | ||
| –16.6 | –9.5 | 1.1 | ||||||
| –18.4 | –1.9 | 22.8 | ||||||
| London | Sellers’ | 10,440 | 13,428 | 0.766 | 0.417–0.713 | 622,946 | ||
| –2.0 | –6.1 | –1.5 | ||||||
| –12.7 | –0.4 | 27.0 | ||||||
| Windsor | Balanced | 7,320 | 11,688 | 0.632 | 0.437–0.687 | 526,331 | ||
| –3.5 | 1.4 | –0.4 | ||||||
| –4.8 | 24.7 | 30.4 | ||||||
| Kingston | Sellers’ | 3,816 | 5,028 | 0.782 | 0.360–0.664 | 569,297 | ||
| –13.6 | –15.7 | –0.1 | ||||||
| –30.0 | –18.3 | 26.0 | ||||||
| Ottawa | Balanced | 18,456 | 28,212 | 0.649 | 0.412–0.714 | 630,657 | ||
| 0.6 | –1.4 | –1.8 | ||||||
| –18.0 | 10.9 | 18.3 | ||||||
| Gatineau | Sellers’ | 5,294 | 5,706 | 0.892 | 0.442–0.746 | 399,100 | ||
| –8.1 | –21.1 | 1.3 | ||||||
| –30.1 | –27.2 | 26.0 | ||||||
| Montréal | Sellers’ | 53,456 | 60,256 | 0.863 | 0.478–0.720 | 532,469 | ||
| –1.0 | –21.2 | –2.4 | ||||||
| –29.7 | –31.3 | 15.6 | ||||||
| Québec City | Sellers’ | 7,627 | 8,666 | 0.819 | 0.499–0.770 | 318,855 | ||
| –19.0 | –28.7 | –1.7 | ||||||
| –40.4 | –32.5 | 7.2 | ||||||
| Sherbrooke | Sellers’ | 2,487 | 2,648 | 0.867 | 0.448–0.756 | 365,691 | ||
| 8.1 | –10.2 | –1.3 | ||||||
| –24.9 | –15.2 | 16.1 | ||||||
| Trois-Rivières | Sellers’ | 1,541 | 1,572 | 0.947 | 0.475–0.802 | 218,514 | ||
| –6.2 | –18.3 | –8.6 | ||||||
| 1.3 | 1.3 | 19.1 | ||||||
| Saguenay | Sellers’ | 1,117 | 1,176 | 0.940 | 0.428–0.740 | 216,349 | ||
| –16.6 | –19.4 | –7.4 | ||||||
| –44.8 | –44.5 | 7.8 | ||||||
| Saint John | Sellers’ | 3,048 | 3,432 | 0.913 | 0.355–0.640 | 245,242 | ||
| –4.9 | –2.1 | –9.8 | ||||||
| 18.7 | 5 | |||||||
The monthly Metro Resale Snapshot provides an overview of the existing home market for 30 areas and expectations for existing home price growth over the short term.
Any errors or omissions in fact or interpretation are the responsibility of Signal49 Research.
Disclaimer: Forecasts and research often involve numerous assumptions and data sources and are subject to inherent risks and uncertainties. This information is not intended as specific investment, accounting, legal, or tax advice.