

Markets Stayed Strong in November
Metropolitan Resale Snapshot
Key Findings
- Canada’s existing housing sales edged up 0.6 per cent in November, consolidating October’s gains. November’s transactions again trailed only 2020 volumes for that month. Resale markets are clearly red-hot, despite last month’s modest sales increase. Decent employment growth and low interest rates are fuelling strong housing demand. A slightly faster 3.3 per cent gain in national listings only slightly lowered markets’ temperature.
- November sales were up from October in 19 of our 30 markets, but lagged year-earlier levels in 18 areas. Listings, meanwhile, rose in 19 markets during November, with 15 of them registering a gain of at least 5 per cent. Listings were still down from a year earlier in 20 markets.
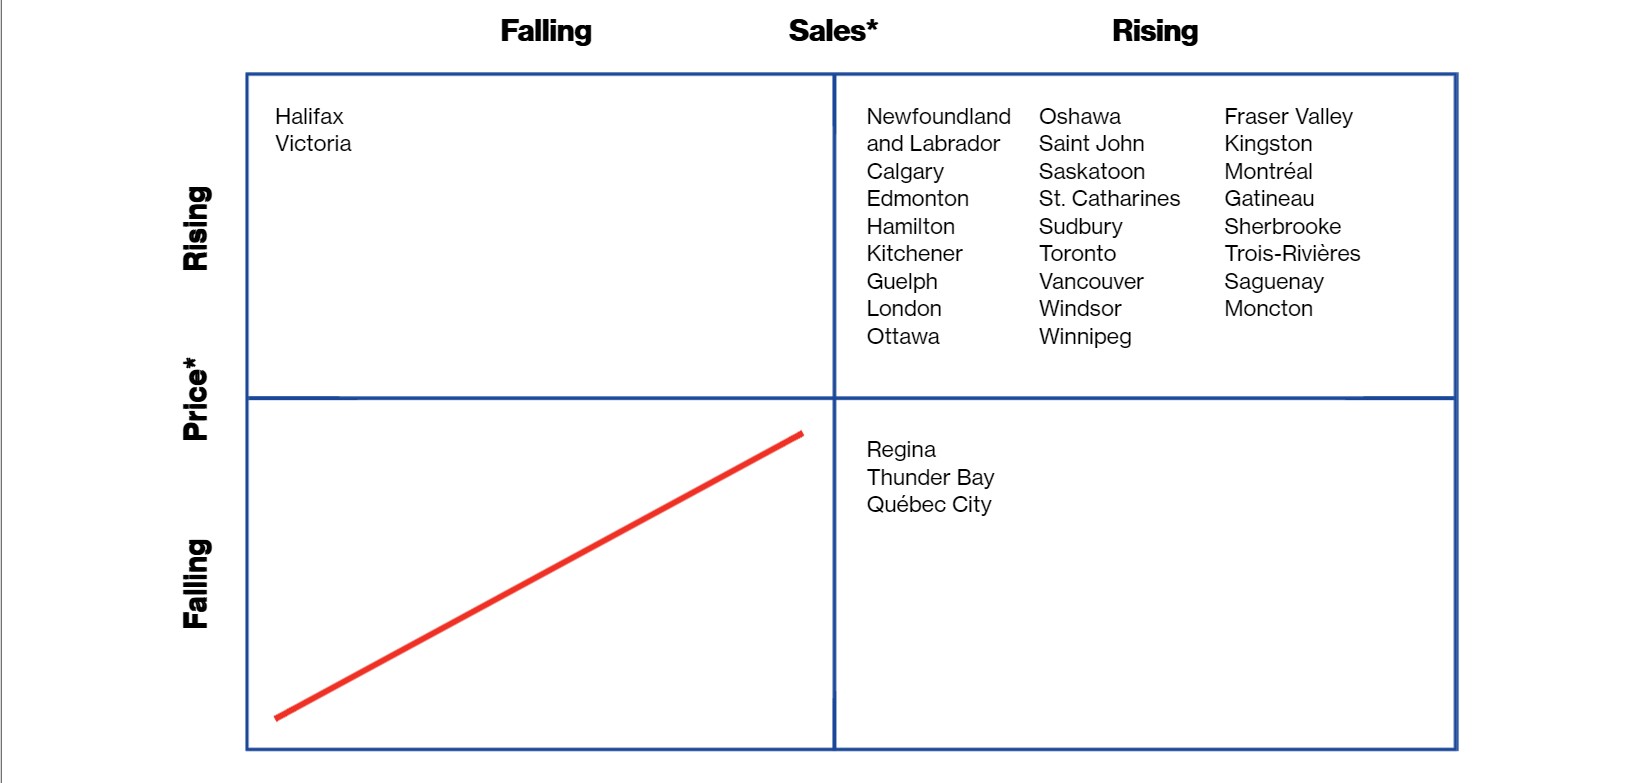
- There is evidence of a tiny slackening in the market. The sales-to-listings ratio fell in 17 jurisdictions during November—though 24 were still in sellers’ territory, unchanged from October. Outsized price growth continued, as the number of markets experiencing year-over-year price growth of at least 20 per cent rose to 17 (from 15 in October).
- November sales rose in Vancouver, Calgary, and Montréal, but fell in Toronto. Calgary’s 9 per cent upswing led the increases, and Montréal’s gain clocked in at just over 4 per cent. Vancouver sales rose 2 per cent. Toronto transactions fell 3 per cent. Sales in all four markets still lag earlier-year highs.
- Listings rose in Vancouver, Toronto, and Montréal during November, but fell in Calgary. Vancouver’s increase was 13 per cent; Toronto and Montréal’s increases were near 8 per cent. Calgary’s dip was about 3 per cent. Listings fell below year-earlier levels in Vancouver, Toronto, and Montréal, but were up in Calgary. Sellers’ markets persist in Toronto, Montréal, and Calgary. Vancouver is balanced.
- The average resale price rose between 2 and 3 per cent in Vancouver, Calgary, and Toronto during November, but was up less than 1 per cent in Montréal. The pace of year-over-year price growth picked up between October and November in the first three cities, but decelerated in Montréal. Annual advances remain in double digits for all but Calgary.
Recent Market Performance
*Average month-to-month change during latest three months
Forecast of Near-Term Price Growth
(year-over-year)
+7%
Victoria, Vancouver, Fraser Valley, Toronto, Oshawa, Hamilton, St. Catharines, Kitchener, Guelph, London, Windsor, Kingston, Ottawa, Gatineau, Montréal, Sherbrooke, Trois-Rivières, Moncton
5–6.9%
Calgary, Saskatoon, Winnipeg, Thunder Bay, Sudbury, Québec City, Saguenay, Saint John, Halifax, Newfoundland and Labrador
3–4.9%
Regina, Edmonton
0–2.9%
None
Falling
None
There is evidence of a tiny slackening in the market—the ratio of sales to listings fell in 17 jurisdictions.
Resale Indicators for November 2021
| Sales-to-new-listings ratio | ||||||||
| Market1 | Market classification | Sales (#)2 | Listings (#) | Level | Balanced market range3 |
Price ($) | ||
| Victoria | Balanced | 8,700 | 10,704 | 0.765 | 0.486–0.772 | 972,738 | ||
| m/m % | –1.1 | 0.1 | –0.4 | |||||
| y/y % | –17.6 | –13.6 | 21.7 | |||||
| Vancouver | Balanced | 43,104 | 63,948 | 0.651 | 0.438–0.719 | 1,244,993 | ||
| 1.6 | 12.9 | 2.1 | ||||||
| 9.7 | –1.9 | 14.8 | ||||||
| Fraser Valley 4 | Balanced | 24,084 | 33,300 | 0.716 | 0.442–0.719 | 1,100,967 | ||
| 2.2 | 17.4 | 3.6 | ||||||
| –9.7 | –4.0 | 21.3 | ||||||
| Calgary | Sellers’ | 39,924 | 44,556 | 0.907 | 0.465–0.730 | 511,823 | ||
| 8.6 | –3.4 | 2.6 | ||||||
| 43.4 | 0.7 | 8.5 | ||||||
| Edmonton | Sellers’ | 29,916 | 41,112 | 0.731 | 0.452–0.711 | 394,679 | ||
| 5.8 | –2.3 | 1.6 | ||||||
| 25.3 | 1.1 | 1.5 | ||||||
| Regina | Balanced | 5,172 | 7,044 | 0.700 | 0.490–0.751 | 317,304 | ||
| 21.1 | –2.8 | –3.2 | ||||||
| 17.1 | 2.6 | 2.9 | ||||||
| Saskatoon | Sellers’ | 8,148 | 10,776 | 0.710 | 0.426–0.679 | 363,681 | ||
| 12.2 | –3.8 | 2.3 | ||||||
| 14.9 | 3.1 | 14.3 | ||||||
| Winnipeg | Sellers’ | 16,560 | 19,260 | 0.886 | 0.450–0.793 | 354,535 | ||
| –5.3 | –13.4 | –0.1 | ||||||
| 3.4 | –7.9 | 6.6 | ||||||
| Thunder Bay | Sellers’ | 2,244 | 2,952 | 0.788 | 0.499–0.761 | 304,320 | ||
| –16.5 | 3.4 | 1.1 | ||||||
| –5.6 | 11.8 | 12.9 | ||||||
| Sudbury | Sellers’ | 3,168 | 3,708 | 0.812 | 0.344–0.681 | 421,240 | ||
| 4.3 | 4.0 | –2.4 | ||||||
| –1.1 | 17.5 | 30.1 | ||||||
| Toronto | Sellers’ | 114,096 | 155,856 | 0.729 | 0.466–0.691 | 1,172,091 | ||
| –2.5 | 7.6 | 2.5 | ||||||
| 3.0 | –11.6 | 21.8 | ||||||
| Oshawa | Sellers’ | 12,792 | 16,596 | 0.757 | 0.480–0.756 | 1,010,534 | ||
| 2.7 | 19.2 | 1.6 | ||||||
| –4.3 | 3.7 | 31.7 | ||||||
| Hamilton | Sellers’ | 14,880 | 19,608 | 0.810 | 0.437–0.802 | 933,776 | ||
| –1.8 | 13.5 | 0.1 | ||||||
| –4.2 | –3.3 | 26.7 | ||||||
| St. Catharines | Sellers’ | 3,876 | 4,812 | 0.769 | 0.397–0.722 | 816,083 | ||
| –13.9 | 5.5 | 4.9 | ||||||
| –7.2 | –2.7 | 32.7 | ||||||
| Kitchener | Sellers’ | 10,716 | 12,828 | 0.800 | 0.485–0.770 | 833,757 | ||
| 4.2 | 9.5 | –1.4 | ||||||
| 1.2 | –0.6 | 28.3 | ||||||
| Guelph | Sellers’ | 3,756 | 4,392 | 0.846 | 0.509–0.840 | 895,474 | ||
| 5.0 | 3.7 | –0.8 | ||||||
| –6.3 | –0.3 | 23.2 | ||||||
| London | Sellers’ | 11,628 | 14,688 | 0.816 | 0.418–0.717 | 681,627 | ||
| 2.2 | 12.3 | 1.3 | ||||||
| –4.9 | 5.1 | 24.1 | ||||||
| Windsor | Balanced | 8,916 | 13,092 | 0.669 | 0.439–0.689 | 579,431 | ||
| 6.3 | 15.8 | 3.9 | ||||||
| 14.5 | 28.8 | 33.4 | ||||||
| Kingston | Sellers’ | 3,984 | 5,556 | 0.718 | 0.362–0.667 | 620,506 | ||
| –4.3 | 8.4 | –0.8 | ||||||
| –19.2 | –10.3 | 24.8 | ||||||
| Ottawa | Sellers’ | 20,316 | 25,428 | 0.777 | 0.414–0.716 | 671,376 | ||
| 1.0 | –2.8 | 1.8 | ||||||
| –10.0 | –12.2 | 19.2 | ||||||
| Gatineau | Sellers’ | 5,887 | 6,879 | 0.855 | 0.444–0.753 | 439,039 | ||
| 5.2 | 6.6 | 3.7 | ||||||
| –16.3 | –5.3 | 29.7 | ||||||
| Montréal | Sellers’ | 53,016 | 65,087 | 0.817 | 0.480–0.725 | 551,122 | ||
| 4.5 | 7.8 | 0.4 | ||||||
| –18.9 | –15.7 | 13.4 | ||||||
| Québec City | Sellers’ | 10,898 | 10,850 | 0.989 | 0.499–0.777 | 325,331 | ||
| 12.9 | 5.4 | –0.8 | ||||||
| –13.1 | –17.1 | 5.6 | ||||||
| Sherbrooke | Sellers’ | 2,458 | 2,869 | 0.898 | 0.447–0.770 | 414,549 | ||
| 6.6 | 23.3 | 7.3 | ||||||
| –14.1 | –7.0 | 40.1 | ||||||
| Trois-Rivières | Sellers’ | 1,825 | 1,807 | 0.994 | 0.476–0.809 | 254,974 | ||
| 19.7 | –6.2 | 4.6 | ||||||
| 24.6 | 11.0 | 27.3 | ||||||
| Saguenay | Sellers’ | 1,558 | 1,721 | 0.909 | 0.429–0.746 | 232,571 | ||
| –2.9 | –8.2 | –0.9 | ||||||
| –15.8 | –6.7 | 6.2 | ||||||
| Saint John | Sellers’ | 3,156 | 3,564 | 0.950 | 0.355–0.647 | 242,717 | ||
| –1.5 | –18.0 | –13.1 | ||||||
| 6.5 | –5.1 | 18.1 | ||||||
| Moncton | Sellers’ | 4,704 | 4,980 | 0.923 | 0.382–0.674 | 294,476 | ||
| –3.7 | –4.6 | 2.2 | ||||||
| –9.5 | –5.5 | 28.0 | ||||||
| Halifax | Balanced | 6,624 | 8,484 | 0.813 | 0.437–0.839 | 491,660 | ||
| –8.3 | 5.7 | –1.4 | ||||||
| –31.9 | –18.7 | 24.0 | ||||||
| Newfoundland and Labrador | Sellers’ | 6,708 | 9,384 | 0.718 | 0.345–0.585 | 277,267 | ||
| (province) | 3.5 | –8.0 | 0.4 | |||||
| 10.5 | –14.9 | 7.5 | ||||||
1 For real estate board area (except Newfoundland, which is province-wide).
2 Italics indicate percentage change. The second row shows the percentage change from the previous month, the third row from the year earlier.
3 Within one standard deviation of long-term average sales-to-new-listings ratio.
4 Includes Abbotsford.
Note: All data are seasonally adjusted.
Sources: Signal49 Research; Canadian Real Estate Association; Quebec Federation of Real Estate Boards.
About the Metro Resale Snapshot
The monthly Metro Resale Snapshot provides an overview of the existing home market for 30 areas and expectations for existing home price growth over the short term.
Disclaimer: Forecasts and research often involve numerous assumptions and data sources and are subject to inherent risks and uncertainties. This information is not intended as specific investment, accounting, legal, or tax advice.
The spread of the novel coronavirus disease (COVID-19) has created uncertainty in all global markets. We’re doing our best to provide timely updates, but information can fall out of date quickly. Visit signal49.ca for our latest insights. Signal49 Research reserves the right to adjust content as necessary.