

Metropolitan Resale Snapshot
Markets Level Off in December
January 28, 2022
Key Findings
- Existing housing sales inched up 0.2 per cent nationally in December, the second straight fractional monthly advance. December’s volume again trailed only 2020 volumes for that month. Sales might have been even higher, had the supply of listings not declined 3.2 per cent. December’s activity lifted full-year 2021 sales to a record 666,995 units—20 per cent above the previous record set in 2020.
- Sales rose between November and December in only 15 of our 30 markets, and were below year-earlier levels in 19 areas. Listings, by contrast, fell in 18 markets during December, including 12 where the decline was at least 5 per cent.
- Last month’s listings were down from a year earlier in 24 markets. Many markets became even tighter as the sales-to-listings ratio rose in 21 jurisdictions. Still, the number of markets in sellers’ territory fell to 22 from 24 in November. Electric price growth continues—the number of markets featuring year-over-year price growth of at least 20 per cent remained at 17 in December, unchanged from November.
- December sales fell in Vancouver, Toronto, and Montréal, but rose in Calgary. Losses were near or below 2 per cent in the three down markets; Calgary’s increase was 8 per cent. The latter city’s gain put sales at record highs, but volumes in the other three markets are well off earlier-year levels.
- Listings rose in Calgary and Toronto during December, but fell in Vancouver and Montréal. The increases were 4 per cent in Calgary and 12 per cent in Toronto, while decreases clocked in at 8 per cent in Vancouver and 17 per cent in Montréal. For the sixth straight month, listings were below year-earlier levels in Vancouver, Toronto, and Montréal, but up in Calgary. Montréal and Calgary are sellers’ markets. Toronto and Vancouver are balanced.
- The average resale price rose almost 3 per cent in Toronto during December, and just under 1 per cent in Vancouver and Montréal. Calgary’s price fell nearly 3 per cent. The pace of year-over-year price growth picked up between November and December in Toronto and Montréal, but was little changed in Vancouver and Calgary. Annual advances remain in double digits for all but Calgary.
Recent Market Performance
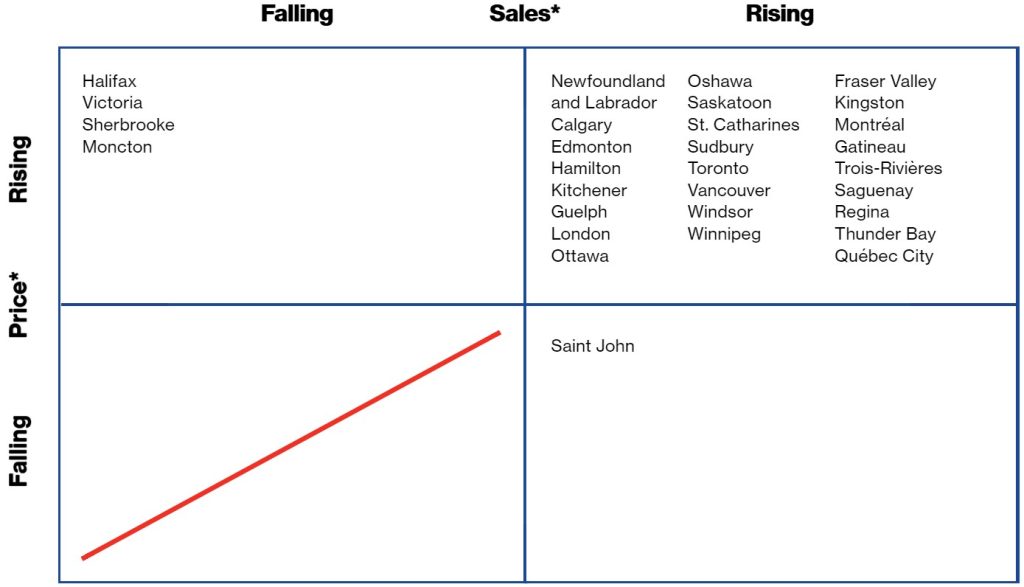
*Average month-to-month change during latest three months.
Forecast of Near-Term Price Growth
(year-over-year)
7% +
Victoria, Vancouver, Fraser Valley, Calgary, Regina, Winnipeg, Thunder Bay, Sudbury, Toronto, Oshawa, Hamilton, St. Catharines, Kitchener, Guelph, London, Windsor, Kingston, Ottawa, Gatineau, Montréal, Sherbrooke, Trois-Rivières, Saguenay, Saint John, Moncton, Halifax
5–6.9%
Saskatoon, Québec City, Newfoundland and Labrador
3–4.9%
Edmonton
0–2.9%
None
Falling
None
Total sales in 2021 set a new record of 666,995 units—20 per cent above the previous record from 2020.
Resale Indicators for December 2021
| Sales-to-new-listings ratio | ||||||||
| Market1 | Market classification | Sales (#)2 | Listings (#) | Level | Balanced market range3 |
Price ($) | ||
| Victoria | Balanced | 8,292 | 11,148 | 0.748 | 0.486–0.773 | 1,025,073 | ||
| m/m % | –2.1 | 4.5 | 4.8 | |||||
| y/y % | –23.8 | –14.3 | 31.2 | |||||
| Vancouver | Balanced | 42,000 | 58,896 | 0.672 | 0.439–0.719 | 1,252,949 | ||
| –1.5 | –8.3 | 0.6 | ||||||
| –11.1 | –17.6 | 15.1 | ||||||
| Fraser Valley 4 | Sellers’ | 25,800 | 33,600 | 0.738 | 0.442–0.719 | 1,134,543 | ||
| 6.4 | 3.1 | 2.7 | ||||||
| –10.7 | –13.1 | 26.3 | ||||||
| Calgary | Sellers’ | 43,800 | 46,404 | 0.963 | 0.464–0.732 | 498,754 | ||
| 8.3 | 3.7 | –2.7 | ||||||
| 43.3 | 4.1 | 8.2 | ||||||
| Edmonton | Sellers’ | 29,412 | 41,520 | 0.736 | 0.450–0.728 | 393,003 | ||
| –1.6 | 1.6 | –0.4 | ||||||
| 23.0 | 4.7 | 5.4 | ||||||
| Regina | Balanced | 4,476 | 6,804 | 0.730 | 0.491–0.751 | 346,721 | ||
| –13.5 | –3.1 | 10.7 | ||||||
| 0.5 | –12.1 | 15.7 | ||||||
| Saskatoon | Balanced | 6,840 | 10,452 | 0.669 | 0.426–0.679 | 359,066 | ||
| –16.2 | –1.2 | –1.4 | ||||||
| 1.8 | –10.8 | 9.5 | ||||||
| Winnipeg | Sellers’ | 17,028 | 18,996 | 0.888 | 0.450–0.793 | 358,497 | ||
| 2.4 | –0.9 | 1.0 | ||||||
| –0.3 | –14.4 | 11.1 | ||||||
| Thunder Bay | Sellers’ | 2,556 | 3,108 | 0.851 | 0.499–0.761 | 325,193 | ||
| 8.1 | 2.8 | 5.5 | ||||||
| 17.7 | 10.7 | 21.5 | ||||||
| Sudbury | Sellers’ | 3,432 | 4,296 | 0.794 | 0.345–0.668 | 432,402 | ||
| –8.3 | –6.8 | –2.0 | ||||||
| –9.8 | 12.9 | 24.6 | ||||||
| Toronto | Balanced | 113,580 | 176,640 | 0.626 | 0.466–0.692 | 1,206,444 | ||
| –0.2 | 12.1 | 2.5 | ||||||
| –14.4 | –9.8 | 24.3 | ||||||
| Oshawa | Sellers’ | 13,404 | 16,488 | 0.758 | 0.480–0.756 | 1,016,598 | ||
| 4.4 | –0.5 | 0.3 | ||||||
| –10.6 | –5.3 | 30.4 | ||||||
| Hamilton | Balanced | 15,876 | 20,724 | 0.778 | 0.437–0.802 | 977,797 | ||
| 5.7 | 7.7 | 4.2 | ||||||
| –7.5 | –4.8 | 27.4 | ||||||
| St. Catharines | Balanced | 4,008 | 5,352 | 0.701 | 0.397–0.722 | 758,489 | ||
| 3.4 | 12.6 | –5.8 | ||||||
| –14.6 | 9.0 | 18.1 | ||||||
| Kitchener | Sellers’ | 10,908 | 12,768 | 0.785 | 0.485–0.770 | 862,992 | ||
| 2.1 | 0.7 | 3.0 | ||||||
| 0.4 | 4.7 | 32.7 | ||||||
| Guelph | Balanced | 3,456 | 4,824 | 0.753 | 0.510–0.840 | 929,290 | ||
| –6.8 | 10.7 | 3.1 | ||||||
| –19.3 | –5.2 | 24.3 | ||||||
| London | Sellers’ | 11,892 | 13,824 | 0.872 | 0.418–0.718 | 697,507 | ||
| 3.8 | –5.0 | 2.1 | ||||||
| –2.0 | –6.0 | 24.4 | ||||||
| Windsor | Sellers’ | 9,420 | 11,040 | 0.825 | 0.439–0.690 | 580,532 | ||
| 4.9 | –15.7 | 0.2 | ||||||
| 12.6 | –1.4 | 25.9 | ||||||
| Kingston | Sellers’ | 4,068 | 4,812 | 0.777 | 0.362–0.668 | 604,092 | ||
| 3.7 | –14.7 | –2.3 | ||||||
| –14.8 | –27.2 | 18.4 | ||||||
| Ottawa | Sellers’ | 20,004 | 24,192 | 0.856 | 0.415–0.717 | 659,503 | ||
| –1.4 | –3.3 | –1.3 | ||||||
| –10.3 | –14.3 | 16.5 | ||||||
| Gatineau | Sellers’ | 6,544 | 6,118 | 1.093 | 0.443–0.757 | 443,664 | ||
| 9.7 | –11.0 | 0.8 | ||||||
| –7.8 | –18.5 | 29.5 | ||||||
| Montréal | Sellers’ | 52,395 | 53,377 | 0.980 | 0.479–0.730 | 554,230 | ||
| –2.2 | –16.6 | 0.5 | ||||||
| –21.6 | –31.6 | 16.9 | ||||||
| Québec City | Sellers’ | 10,522 | 10,040 | 1.064 | 0.499–0.781 | 335,595 | ||
| –3.5 | –7.9 | 2.9 | ||||||
| –18.7 | –34.5 | 7.9 | ||||||
| Sherbrooke | Sellers’ | 2,065 | 2,066 | 0.949 | 0.447–0.772 | 383,908 | ||
| –15.5 | –28.2 | –7.2 | ||||||
| –32.0 | –32.7 | 21.4 | ||||||
| Trois–Rivières | Sellers’ | 1,779 | 1,457 | 1.280 | 0.474–0.817 | 276,355 | ||
| –3.4 | –18.3 | 7.7 | ||||||
| 11.2 | –22.2 | 30.4 | ||||||
| Saguenay | Sellers’ | 1,792 | 2,043 | 0.913 | 0.429–0.749 | 244,562 | ||
| 12.3 | 16.8 | 4.5 | ||||||
| 3.1 | –8.9 | 15.0 | ||||||
| Saint John | Sellers’ | 3,156 | 3,828 | 0.878 | 0.356–0.650 | 249,527 | ||
| 0.4 | 7.4 | 2.7 | ||||||
| –4.4 | –9.1 | 30.5 | ||||||
| Moncton | Sellers’ | 4,392 | 4,464 | 0.985 | 0.382–0.677 | 317,980 | ||
| –5.7 | –11.0 | 6.5 | ||||||
| 0.0 | –12.1 | 38.0 | ||||||
| Halifax | Sellers’ | 6,648 | 7,284 | 0.934 | 0.441–0.857 | 494,693 | ||
| –4.0 | –15.5 | 0.6 | ||||||
| –33.3 | –29.4 | 22.4 | ||||||
| Newfoundland and Labrador | Sellers’ | 7,200 | 8,580 | 0.854 | 0.344–0.587 | 275,450 | ||
| 7.1 | –10.2 | 1.2 | ||||||
| 20.5 | –23.6 | 6.6 | ||||||
The monthly Metro Resale Snapshot provides an overview of the existing home market for 30 areas and expectations for existing home price growth over the short term.
Any errors or omissions in fact or interpretation are the responsibility of Signal49 Research.
Disclaimer: Forecasts and research often involve numerous assumptions and data sources and are subject to inherent risks and uncertainties. This information is not intended as specific investment, accounting, legal, or tax advice.