

Resale Markets Throttle Back, but Remain Brisk
Metropolitan Resale Snapshot
- Canada’s existing housing markets plateaued in April. Sales pulled back from red-hot March levels in most markets, and listings rose in many areas. Markets remained generally boiling, though, due to low interest rates and the ongoing move to outlying markets.
- Sales fell in 24 of our 30 markets during April, with losses exceeding 5 per cent in 22 areas. Transactions nonetheless remained above their year-earlier levels in all 30 markets, partly due to last year’s COVID-19 restrictions. Listings also eased—albeit in only 20 of 30 markets—during April. Of these, 17 areas saw declines of more than 5 per cent. Listings still exceeded their year-earlier levels in all 30 markets.
- Such minor rebalancing is reflected in an easing sales-to-listings ratio in 19 markets, as well as slower price growth in 17 areas. Most markets continue to be extremely tight; 22 remain in sellers’ territory. Prices rose at least 20 per cent year-over-year in 24 areas.
- April sales dropped significantly in Vancouver and Toronto, eased in Montréal, and rose briskly in Calgary. Indeed, Calgary’s sales set a record—remarkable for an economically struggling city. Vancouver’s sales were still at a five-year high, while those in Toronto were coming off record volumes in March. Montréal’s sales have now fallen 18 per cent since peaking last September.
- Listings were little changed in Vancouver, Calgary, and Montréal during April, but fell significantly in Toronto. Still, all four cities’ listings were sharply above pandemic-depressed levels a year earlier. Sellers’ conditions persist in all four cities.
- Prices rose in Vancouver, Calgary, and Montréal last month, but eased in Toronto. Despite Toronto’s decrease, its April prices were 33 per cent above a year earlier. Montréal saw a similar annual gain. Yearly price increases in Vancouver and Calgary were closer to 20 per cent.
Recent market performance
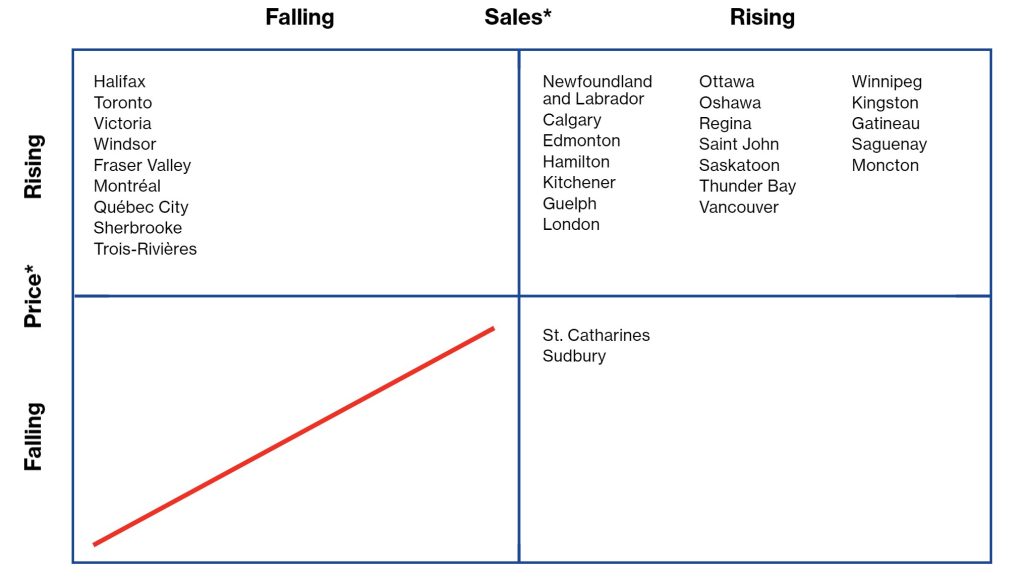
*Average month-to-month change during latest three months
Forecast of near-term price growth
(year-over-year)
7% +
Victoria, Vancouver, Fraser Valley, Calgary, Edmonton, Regina, Winnipeg, Thunder Bay, Sudbury, Toronto, Oshawa, Hamilton, St. Catharines, Kitchener, Guelph, London, Windsor, Kingston, Ottawa, Gatineau, Montréal, Québec City, Sherbrooke, Trois-Rivières, Saguenay, Saint John, Moncton, Halifax, Newfoundland and Labrador
5–6.9%
Saskatoon
3–4.9%
None
0–2.9%
None
Falling
None
Further supply could be needed to fulfill homebuyer demand.
Resale indicators for April 2021
| Sales-to-new-listings ratio | ||||||||
| Market1 | Market classification | Sales (#)2 | Listings (#) | Level | Balanced market range3 |
Price ($) | ||
| Victoria | Sellers’ | 10,416 | 12,804 | 0.882 | 0.483–0.767 | 887,728 | ||
| m/m % | –7.7 | 6.7 | 0.5 | |||||
| y/y % | 291.0 | 141.4 | 25.7 | |||||
| Vancouver | Sellers’ | 51,336 | 75,384 | 0.755 | 0.435–0.718 | 1,188,165 | ||
| –17.3 | –2.5 | 1.3 | ||||||
| 353.7 | 250.0 | 17.4 | ||||||
| Fraser Valley4 | Balanced | 28,392 | 42,552 | 0.703 | 0.440–0.711 | 1,025,368 | ||
| –14.3 | –2.4 | 2.9 | ||||||
| 341.4 | 274.1 | 36.0 | ||||||
| Calgary | Sellers’ | 44,808 | 57,924 | 0.753 | 0.463–0.726 | 519,091 | ||
| 10.6 | 0.8 | 1.8 | ||||||
| 464.0 | 533.5 | 21.2 | ||||||
| Edmonton | Balanced | 32,784 | 48,000 | 0.685 | 0.451–0.711 | 398,592 | ||
| –0.1 | 0.4 | –1.3 | ||||||
| 296.5 | 269.3 | 12.9 | ||||||
| Regina | Balanced | 5,136 | 7,068 | 0.709 | 0.489–0.752 | 346,282 | ||
| –7.4 | –13.6 | 6.6 | ||||||
| 207.9 | 141.4 | 17.1 | ||||||
| Saskatoon | Balanced | 8,148 | 12,576 | 0.656 | 0.424–0.678 | 342,859 | ||
| –16.2 | 1.8 | –0.7 | ||||||
| 199.1 | 117.9 | 6.6 | ||||||
| Winnipeg | Sellers’ | 19,020 | 19,524 | 1.006 | 0.446–0.791 | 343,839 | ||
| –12.0 | –13.4 | –0.8 | ||||||
| 148.0 | 50.4 | 13.0 | ||||||
| Thunder Bay | Sellers’ | 2,904 | 2,892 | 1.002 | 0.498–0.755 | 296,802 | ||
| 0.4 | –10.4 | 2.8 | ||||||
| 165.9 | 276.6 | 24.9 | ||||||
| Sudbury | Sellers’ | 3,624 | 4,320 | 0.868 | 0.342–0.672 | 378,489 | ||
| –17.9 | –7.5 | 1.3 | ||||||
| 167.3 | 174.8 | 50.6 | ||||||
| Toronto | Sellers’ | 129,108 | 195,852 | 0.706 | 0.464–0.687 | 1,049,874 | ||
| –19.7 | –12.3 | –3.6 | ||||||
| 346.4 | 238.2 | 33.0 | ||||||
| Oshawa | Sellers’ | 15,624 | 19,704 | 0.806 | 0.478–0.749 | 873,337 | ||
| –29.8 | –26.9 | –0.5 | ||||||
| 239.9 | 171.0 | 46.8 | ||||||
| Hamilton | Balanced | 17,724 | 24,444 | 0.759 | 0.433–0.797 | 834,605 | ||
| –23.5 | –6.9 | –2.2 | ||||||
| 238.8 | 200.0 | 39.4 | ||||||
| St. Catharines | Sellers’ | 5,028 | 5,868 | 0.860 | 0.396–0.716 | 702,344 | ||
| –12.7 | –21.6 | 0.2 | ||||||
| 288.0 | 103.8 | 48.3 | ||||||
| Kitchener | Sellers’ | 11,736 | 14,904 | 0.866 | 0.482–0.764 | 747,568 | ||
| –26.5 | –20.8 | –0.6 | ||||||
| 244.4 | 157.7 | 34.8 | ||||||
| Guelph | Balanced | 4,056 | 5,016 | 0.836 | 0.507–0.836 | 812,281 | ||
| –27.9 | –17.2 | 3.1 | ||||||
| 284.1 | 156.4 | 37.1 | ||||||
| London | Sellers’ | 11,796 | 14,796 | 0.852 | 0.417–0.711 | 626,989 | ||
| –20.3 | –7.4 | 0.5 | ||||||
| 180.9 | 126.7 | 51.8 | ||||||
| Windsor | Sellers’ | 7,920 | 10,464 | 0.807 | 0.436–0.687 | 533,081 | ||
| –17.2 | –5.3 | 3.3 | ||||||
| 138.3 | 109.1 | 61.8 | ||||||
| Kingston | Sellers’ | 5,088 | 6,240 | 0.826 | 0.359–0.670 | 570,520 | ||
| –21.2 | –9.9 | –0.9 | ||||||
| 523.5 | 133.2 | 36.0 | ||||||
| Ottawa | Sellers’ | 22,428 | 29,664 | 0.798 | 0.411–0.714 | 640,607 | ||
| –22.4 | 3.9 | –1.8 | ||||||
| 185.3 | 175.6 | 41.0 | ||||||
| Gatineau | Sellers’ | 6,719 | 8,674 | 0.757 | 0.440–0.743 | 404,410 | ||
| –5.6 | 16.7 | 5.6 | ||||||
| 244.5 | 344.2 | 40.6 | ||||||
| Montréal | Sellers’ | 57,632 | 77,706 | 0.748 | 0.475–0.718 | 559,476 | ||
| 0.9 | 2.6 | 4.1 | ||||||
| 233.9 | 333.3 | 32.4 | ||||||
| Québec City | Balanced | 10,321 | 14,692 | 0.759 | 0.497–0.768 | 334,960 | ||
| –9.7 | –8.5 | 3.4 | ||||||
| 172.6 | 268.8 | 23.5 | ||||||
| Sherbrooke | Sellers’ | 2,571 | 3,333 | 0.808 | 0.445–0.756 | 373,581 | ||
| –6.7 | 3.3 | 0.9 | ||||||
| 176.1 | 412.8 | 29.6 | ||||||
| Trois-Rivières | Balanced | 1,610 | 2,030 | 0.711 | 0.474–0.797 | 233,145 | ||
| –6.4 | –5.3 | 5.4 | ||||||
| 190.6 | 374.4 | 47.3 | ||||||
| Saguenay | Sellers’ | 1,975 | 2,100 | 0.959 | 0.426–0.735 | 225,441 | ||
| 6.3 | –6.7 | –1.9 | ||||||
| 352.4 | 680.8 | 30.3 | ||||||
| Saint John | Sellers’ | 3,696 | 3,852 | 0.861 | 0.356–0.633 | 268,644 | ||
| 15.4 | 0.9 | 0.6 | ||||||
| 156.7 | 186.6 | 58.6 | ||||||
| Moncton | Sellers’ | 5,436 | 4,932 | 1.082 | 0.380–0.665 | 272,721 | ||
| –3.4 | –9.7 | 3.8 | ||||||
| 256.7 | 202.2 | 34.8 | ||||||
| Halifax | Sellers’ | 8,964 | 9,504 | 0.907 | 0.434–0.835 | 454,561 | ||
| –11.8 | –2.3 | –0.5 | ||||||
| 133.4 | 169.4 | 39.0 | ||||||
| Newfoundland and Labrador | Sellers’ | 7,368 | 11,712 | 0.599 | 0.343–0.579 | 264,428 | ||
| (province) | 6.0 | 1.6 | 2.8 | |||||
| 103.3 | 173.4 | 11.3 | ||||||
The monthly Metro Resale Snapshot provides an overview of the existing home market for 30 areas and expectations for existing home price growth over the short term.
Any errors or omissions in fact or interpretation are the responsibility of Signal49 Research.
Disclaimer: Forecasts and research often involve numerous assumptions and data sources and are subject to inherent risks and uncertainties. This information is not intended as specific investment, accounting, legal, or tax advice.
| Sales-to-new-listings ratio | ||||||||
| Market1 | Market classification | Sales (#)2 | Listings (#) | Level | Balanced market range3 |
Price ($) |
||
| Victoria | Sellers’ | 10,416 | 12,804 | 0.882 | 0.483–0.767 | 887,728 | ||
| m/m % | –7.7 | 6.7 | 0.5 | |||||
| y/y % | 291.0 | 141.4 | 25.7 | |||||
| Vancouver | Sellers’ | 51,336 | 75,384 | 0.755 | 0.435–0.718 | 1,188,165 | ||
| –17.3 | –2.5 | 1.3 | ||||||
| 353.7 | 250.0 | 17.4 | ||||||
| Fraser Valley4 | Balanced | 28,392 | 42,552 | 0.703 | 0.440–0.711 | 1,025,368 | ||
| –14.3 | –2.4 | 2.9 | ||||||
| 341.4 | 274.1 | 36.0 | ||||||
| Calgary | Sellers’ | 44,808 | 57,924 | 0.753 | 0.463–0.726 | 519,091 | ||
| 10.6 | 0.8 | 1.8 | ||||||
| 464.0 | 533.5 | 21.2 | ||||||
| Edmonton | Balanced | 32,784 | 48,000 | 0.685 | 0.451–0.711 | 398,592 | ||
| –0.1 | 0.4 | –1.3 | ||||||
| 296.5 | 269.3 | 12.9 | ||||||
| Regina | Balanced | 5,136 | 7,068 | 0.709 | 0.489–0.752 | 346,282 | ||
| –7.4 | –13.6 | 6.6 | ||||||
| 207.9 | 141.4 | 17.1 | ||||||
| Saskatoon | Balanced | 8,148 | 12,576 | 0.656 | 0.424–0.678 | 342,859 | ||
| –16.2 | 1.8 | –0.7 | ||||||
| 199.1 | 117.9 | 6.6 | ||||||
| Winnipeg | Sellers’ | 19,020 | 19,524 | 1.006 | 0.446–0.791 | 343,839 | ||
| –12.0 | –13.4 | –0.8 | ||||||
| 148.0 | 50.4 | 13.0 | ||||||
| Thunder Bay | Sellers’ | 2,904 | 2,892 | 1.002 | 0.498–0.755 | 296,802 | ||
| 0.4 | –10.4 | 2.8 | ||||||
| 165.9 | 276.6 | 24.9 | ||||||
| Sudbury | Sellers’ | 3,624 | 4,320 | 0.868 | 0.342–0.672 | 378,489 | ||
| –17.9 | –7.5 | 1.3 | ||||||
| 167.3 | 174.8 | 50.6 | ||||||
| Toronto | Sellers’ | 129,108 | 195,852 | 0.706 | 0.464–0.687 | 1,049,874 | ||
| –19.7 | –12.3 | –3.6 | ||||||
| 346.4 | 238.2 | 33.0 | ||||||
| Oshawa | Sellers’ | 15,624 | 19,704 | 0.806 | 0.478–0.749 | 873,337 | ||
| –29.8 | –26.9 | –0.5 | ||||||
| 239.9 | 171.0 | 46.8 | ||||||
| Hamilton | Balanced | 17,724 | 24,444 | 0.759 | 0.433–0.797 | 834,605 | ||
| –23.5 | –6.9 | –2.2 | ||||||
| 238.8 | 200.0 | 39.4 | ||||||
| St. Catharines | Sellers’ | 5,028 | 5,868 | 0.860 | 0.396–0.716 | 702,344 | ||
| –12.7 | –21.6 | 0.2 | ||||||
| 288.0 | 103.8 | 48.3 | ||||||
| Kitchener | Sellers’ | 11,736 | 14,904 | 0.866 | 0.482–0.764 | 747,568 | ||
| –26.5 | –20.8 | –0.6 | ||||||
| 244.4 | 157.7 | 34.8 | ||||||
| Guelph | Balanced | 4,056 | 5,016 | 0.836 | 0.507–0.836 | 812,281 | ||
| –27.9 | –17.2 | 3.1 | ||||||
| 284.1 | 156.4 | 37.1 | ||||||
| London | Sellers’ | 11,796 | 14,796 | 0.852 | 0.417–0.711 | 626,989 | ||
| –20.3 | –7.4 | 0.5 | ||||||
| 180.9 | 126.7 | 51.8 | ||||||
| Windsor | Sellers’ | 7,920 | 10,464 | 0.807 | 0.436–0.687 | 533,081 | ||
| –17.2 | –5.3 | 3.3 | ||||||
| 138.3 | 109.1 | 61.8 | ||||||
| Kingston | Sellers’ | 5,088 | 6,240 | 0.826 | 0.359–0.670 | 570,520 | ||
| –21.2 | –9.9 | –0.9 | ||||||
| 523.5 | 133.2 | 36.0 | ||||||
| Ottawa | Sellers’ | 22,428 | 29,664 | 0.798 | 0.411–0.714 | 640,607 | ||
| –22.4 | 3.9 | –1.8 | ||||||
| 185.3 | 175.6 | 41.0 | ||||||
| Gatineau | Sellers’ | 6,719 | 8,674 | 0.757 | 0.440–0.743 | 404,410 | ||
| –5.6 | 16.7 | 5.6 | ||||||
| 244.5 | 344.2 | 40.6 | ||||||
| Montréal | Sellers’ | 57,632 | 77,706 | 0.748 | 0.475–0.718 | 559,476 | ||
| 0.9 | 2.6 | 4.1 | ||||||
| 233.9 | 333.3 | 32.4 | ||||||
| Québec City | Balanced | 10,321 | 14,692 | 0.759 | 0.497–0.768 | 334,960 | ||
| –9.7 | –8.5 | 3.4 | ||||||
| 172.6 | 268.8 | 23.5 | ||||||
| Sherbrooke | Sellers’ | 2,571 | 3,333 | 0.808 | 0.445–0.756 | 373,581 | ||
| –6.7 | 3.3 | 0.9 | ||||||
| 176.1 | 412.8 | 29.6 | ||||||
| Trois-Rivières | Balanced | 1,610 | 2,030 | 0.711 | 0.474–0.797 | 233,145 | ||
| –6.4 | –5.3 | 5.4 | ||||||
| 190.6 | 374.4 | 47.3 | ||||||
| Saguenay | Sellers’ | 1,975 | 2,100 | 0.959 | 0.426–0.735 | 225,441 | ||
| 6.3 | –6.7 | –1.9 | ||||||
| 352.4 | 680.8 | 30.3 | ||||||
| Saint John | Sellers’ | 3,696 | 3,852 | 0.861 | 0.356–0.633 | 268,644 | ||
| 15.4 | 0.9 | 0.6 | ||||||
| 156.7 | ||||||||