

Metropolitan Resale Snapshot
The Resale Market Stabilizes
Key Findings
- National existing home sales inched higher in October as an increase of 1.3 per cent interrupted a string of seven straight declines. Buyers continue to be wary against a backdrop of high interest rates and uncertain economic prospects. Despite October’s monthly advance, transactions hover 36 per cent below October 2021 and 18 per cent below the 10-year average of seasonally adjusted monthly sales.
- National listings remain stable, rising 2.2 per cent in October after having dipped 1.2 per cent in September—they’re now only 1.9 per cent below last year’s volume. Potential sellers seem confident that the market will eventually stabilize and are thus waiting to list their homes. The slightly larger rise in listings than in sales left Canada’s average resale price down only 0.6 per cent in October, although this marked the seventh monthly drop in the past eight months.
- Sales and listings patterns continue to be mixed. Transactions rose in 17 of our 30 markets in October, with seven areas reporting gains of at least 5 per cent. Still, volumes remain below a year earlier in 29 areas. Listings, meanwhile, enjoyed widespread increases in October, with volumes up in 20 areas, but they still trailed year-earlier volumes in 16 jurisdictions. Despite the modest sales increase, few markets tightened; the sales-to-listing ratio rose in only 13 areas. We identified 21 balanced markets in October, down from 22 areas in September. Three markets—Trois-Rivières, Saint John, and Newfoundland and Labrador—are in a sellers’ state, mainly due to weak listings. Buyers’ conditions prevail in six areas. Pricing continues to be soft as 18 areas suffered month-to-month declines in October, pulling values below year-earlier levels in 17 markets.
- During October, sales rose in Vancouver, were little changed in Calgary and Toronto, and continued to pull back in Montréal. Vancouver’s hike was 6.5 per cent, while Montréal’s loss was 6.2 per cent. For Vancouver and Calgary, October’s increase interrupted roughly half a year of sales declines. In Toronto, October’s stability also followed a lengthy period of generally falling sales. Montréal’s drop was the seventh in the past eight months. Monthly transactions continue to trail their 10-year average in all but Calgary.
- October saw listings rise in Vancouver and Toronto, fall in Montréal, and stabilize in Calgary. Vancouver’s increase was just over 10 per cent, while Toronto’s was roughly 6 per cent. Listings fell about 7 per cent in Montréal. Vancouver and Toronto have slipped into buyers’ conditions, while Montréal and Calgary are balanced.
- During October, the average resale price fell 2.1 per cent in Montréal and 1.0 per cent in Vancouver. Calgary’s price was up 1.2 per cent, and Toronto’s value was unchanged. Prices are now below year-earlier levels in both Toronto (5.3 per cent) and Montréal (1.9 per cent). Prices remain 1.1 per cent higher in Vancouver and are up 4.5 per cent in Calgary.
Recent Market Performance
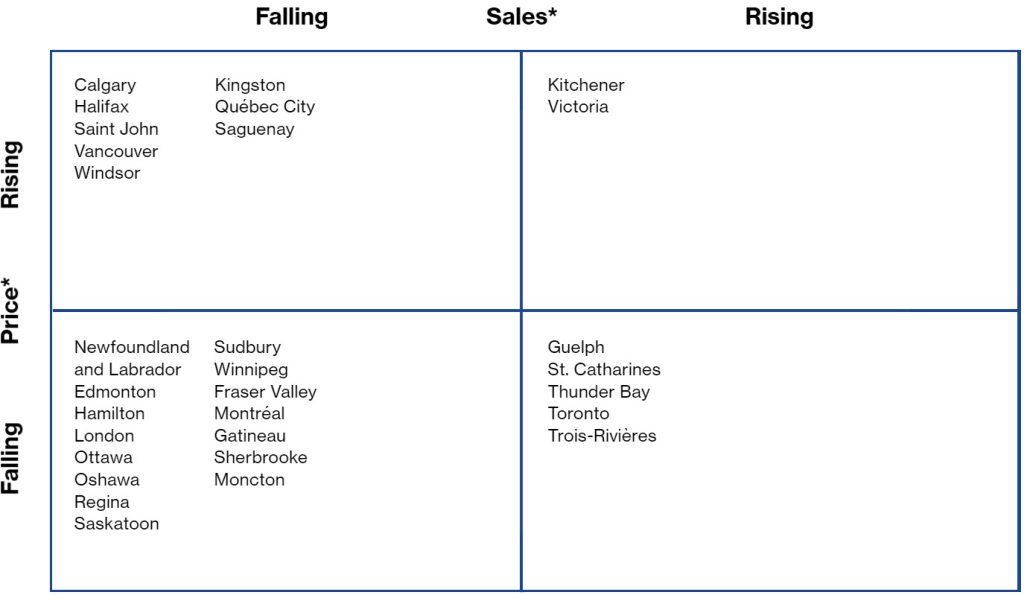
*Average month-to-month change during latest three months.
Forecast of Near-Term Price Growth
(year-over-year)
7% +
Trois-Rivières, Saguenay
5–6.9%
Québec City, Sherbrooke, Moncton, Halifax, Newfoundland and Labrador
3–4.9%
Calgary, Kingston
0–2.9%
Vancouver, Edmonton, Winnipeg, London, Windsor, Ottawa, Gatineau, Montréal, Saint John
Falling
Victoria, Fraser Valley, Regina, Saskatoon, Thunder Bay, Sudbury, Toronto, Oshawa, Hamilton, St. Catharines, Kitchener, Guelph

National listings remain stable, rising 2.2 per cent in October after having dipped 1.2 per cent in September—they’re now only 1.9 per cent below last year’s volume.
Resale Indicators for October 2022
| Sales–to–new–listings ratio | ||||||||
| Market1 | Market classification | Sales (#)2 | Listings (#) | Level | Balanced market range3 |
Price ($) | ||
| 5,760 | 12,108 | 956,817 | ||||||
| Victoria | Buyers’ | 19.7 | –2.1 | 0.462 | 0.485–0.772 | –2.6 | ||
| –34.6 | 14.9 | –3.6 | ||||||
| 23,388 | 54,840 | 1,240,736 | ||||||
| Vancouver | Buyers’ | 6.5 | 10.5 | 0.410 | 0.438–0.718 | –1.0 | ||
| –46.1 | –3.2 | 1.1 | ||||||
| 11,112 | 27,132 | 987,910 | ||||||
| Fraser Valley (4) | Buyers’ | 1.0 | 3.4 | 0.395 | 0.440–0.718 | –0.1 | ||
| –54.1 | –5.3 | –8.1 | ||||||
| 31,224 | 43,212 | 522,971 | ||||||
| Calgary | Balanced | 0.2 | 0.4 | 0.715 | 0.467–0.738 | 1.2 | ||
| –18.3 | –9.0 | 4.5 | ||||||
| 23,688 | 45,528 | 385,724 | ||||||
| Edmonton | Balanced | 3.3 | 0.3 | 0.525 | 0.452–0.727 | 0.3 | ||
| –22.1 | 0.1 | –0.1 | ||||||
| 4,224 | 6,228 | 313,561 | ||||||
| Regina | Balanced | –1.9 | –3.7 | 0.673 | 0.493–0.751 | 4.4 | ||
| –3.8 | –14.5 | –4.9 | ||||||
| 6,048 | 10,008 | 334,338 | ||||||
| Saskatoon | Balanced | 6.3 | 2.5 | 0.603 | 0.429–0.681 | –6.0 | ||
| –18.7 | –9.2 | –7.2 | ||||||
| 12,696 | 20,232 | 358,567 | ||||||
| Winnipeg | Balanced | 2.2 | 2.4 | 0.623 | 0.454–0.795 | –2.2 | ||
| –28.8 | –7.6 | –0.2 | ||||||
| 2,352 | 3,348 | 313,293 | ||||||
| Thunder Bay | Balanced | 12.6 | 5.7 | 0.695 | 0.502–0.767 | –2.3 | ||
| –6.2 | 19.2 | 0.2 | ||||||
| 2,100 | 3,648 | 434,007 | ||||||
| Sudbury | Balanced | –20.5 | –0.7 | 0.596 | 0.349–0.676 | –4.3 | ||
| –37.3 | –12.6 | –5.7 | ||||||
| 62,028 | 142,656 | 1,098,502 | ||||||
| Toronto | Buyers’ | 0.2 | 6.2 | 0.453 | 0.464–0.690 | 0.0 | ||
| –50.0 | –10.2 | –5.3 | ||||||
| 7,800 | 15,792 | 913,353 | ||||||
| Oshawa | Balanced | 0.0 | 12.5 | 0.496 | 0.480–0.754 | –0.8 | ||
| –40.9 | 4.0 | –8.9 | ||||||
| 9,168 | 20,232 | 883,714 | ||||||
| Hamilton | Buyers’ | 1.7 | 2.0 | 0.436 | 0.436–0.801 | 1.3 | ||
| –41.1 | 11.7 | –5.8 | ||||||
| 2,460 | 5,568 | 722,582 | ||||||
| St. Catharines | Balanced | 7.9 | 3.8 | 0.403 | 0.397–0.721 | –2.7 | ||
| –44.9 | 16.6 | –10.0 | ||||||
| 6,612 | 12,552 | 776,696 | ||||||
| Kitchener | Balanced | –2.1 | 6.0 | 0.512 | 0.485–0.769 | –1.2 | ||
| –40.4 | –0.2 | –9.0 | ||||||
| 2,652 | 4,632 | 824,907 | ||||||
| Guelph | Balanced | 10.5 | 4.0 | 0.554 | 0.507–0.838 | –4.3 | ||
| –28.0 | 5.8 | –10.9 | ||||||
| 6,840 | 15,300 | 659,888 | ||||||
| London | Balanced | 1.8 | 0.5 | 0.429 | 0.418–0.717 | –0.3 | ||
| –42.5 | 14.0 | –3.5 | ||||||
| 4,920 | 11,016 | 565,231 | ||||||
| Windsor | Buyers’ | –6.4 | 1.1 | 0.424 | 0.438–0.689 | 1.2 | ||
| –44.2 | –9.2 | –0.9 | ||||||
| 2,844 | 6,624 | 649,902 | ||||||
| Kingston | Balanced | –3.7 | 6.0 | 0.415 | 0.362–0.672 | 3.7 | ||
| –33.4 | 32.1 | 3.6 | ||||||
| 12,324 | 27,636 | 655,796 | ||||||
| Ottawa | Balanced | –2.9 | 3.5 | 0.454 | 0.416–0.717 | –0.8 | ||
| –41.9 | –0.2 | –2.0 | ||||||
| 3,843 | 7,163 | 432,913 | ||||||
| Gatineau | Balanced | –3.0 | 6.4 | 0.549 | 0.448–0.759 | –4.2 | ||
| –31.5 | 11.4 | 0.8 | ||||||
| 32,521 | 59,488 | 544,057 | ||||||
| Montréal | Balanced | –6.2 | –7.3 | 0.532 | 0.482–0.733 | –2.1 | ||
| –35.4 | 1.6 | –1.9 | ||||||
| 7,843 | 10,822 | 357,996 | ||||||
| Québec City | Balanced | –3.6 | –5.2 | 0.704 | 0.503–0.788 | 3.9 | ||
| –16.9 | 5.6 | 10.0 | ||||||
| 1,745 | 2,342 | 419,653 | ||||||
| Sherbrooke | Balanced | –14.1 | –7.9 | 0.711 | 0.452–0.783 | 5.5 | ||
| –24.5 | 2.4 | 9.0 | ||||||
| 1,509 | 1,713 | 285,193 | ||||||
| Trois–Rivières | Sellers’ | 1.2 | –16.0 | 0.827 | 0.480–0.823 | –3.0 | ||
| 1.5 | –14.2 | 13.9 | ||||||
| 1,072 | 1,743 | 263,119 | ||||||
| Saguenay | Balanced | –20.9 | 8.5 | 0.610 | 0.431–0.766 | 2.2 | ||
| –36.1 | –0.9 | 11.0 | ||||||
| 2,268 | 2,832 | 280,996 | ||||||
| Saint John | Sellers’ | 2.7 | –12.9 | 0.858 | 0.355–0.667 | –5.4 | ||
| –28.9 | –36.9 | 0.6 | ||||||
| 3,180 | 5,568 | 316,313 | ||||||
| Moncton | Balanced | 3.1 | 11.5 | 0.572 | 0.384–0.686 | –3.0 | ||
| –37.5 | 0.7 | 6.7 | ||||||
| 5,124 | 6,840 | 532,728 | ||||||
| Halifax | Balanced | 9.2 | –8.9 | 0.768 | 0.446–0.862 | 3.1 | ||
| –30.0 | –17.9 | 8.0 | ||||||
| 5,388 | 8,964 | 292,514 | ||||||
| Newfoundland and Labrador | Sellers’ | –1.5 | –0.9 | 0.614 | 0.347–0.595 | 0.6 | ||
| –19.2 | –13.1 | 6.0 | ||||||
- For real estate board area (except Newfoundland, which is province-wide).
- Italics indicate percentage change. The second row shows the percentage change from the previous month, the third row from the year earlier.
- Within one standard deviation of long-term average sales-to-new-listings ratio.
- Includes Abbotsford.
Note: All data are seasonally adjusted.
Sources: Signal49 Research; Canadian Real Estate Association; Quebec Federation of Real Estate Boards.
The monthly Metro Resale Snapshot provides an overview of the existing home market for 30 areas and expectations for existing home price growth over the short term.
Any errors or omissions in fact or interpretation are the responsibility of Signal49 Research.
Disclaimer: Forecasts and research often involve numerous assumptions and data sources and are subject to inherent risks and uncertainties. This information is not intended as specific investment, accounting, legal, or tax advice.