

The Resale Market Continues to Look for a Bottom
Metropolitan Resale Snapshot
Key Findings
- National existing home sales continued to drop in September, with the 3.9 per cent decline representing the seventh straight monthly drop. High interest rates and softening economic prospects are making buyers cautious. The decline puts transactions 32 per cent below September 2021 and 19 per cent below the 10-year average of seasonally adjusted monthly sales.
- National listings largely stabilized, dropping just 0.8 per cent in September,
- after a 5 per cent drop in August. The decline put listings 1.4 per cent below their year-ago volume. Potential sellers clearly aren’t panicking and are waiting for the market to stabilize before listing their homes. The supply reduction partially offset the sales decline, limiting the monthly drop in Canada’s average resale price to 1.2 per cent in September after dips in five of the six previous months.
- Sales and listings trends were mixed. Transactions dropped in 22 of our 30 markets in September, with nine areas reporting declines of at least 5 per cent. Still, volumes were below a year earlier in 29 areas. Listings declines were less widespread in September, with 15 areas witnessing drops, but they still exceeded year-earlier volumes in 17 jurisdictions. Prevalent sales easing slackened many markets last month; the sales-to-listing ratio fell in 22 areas. We find 22 markets were balanced in September, up from 21 areas in August. Soft listings have helped push Sudbury, Saguenay, Saint John, and Newfoundland and Labrador into a sellers’ state. Buyers’ conditions prevail in four areas. Prices continue to moderate; 16 areas saw month-to-month declines in September, although values remain above year-earlier levels in 22 markets.
- Sales fell in each of Vancouver, Calgary, Toronto, and Montréal in September, with declines ranging from 4.1 per cent in Calgary to 10.3 per cent in Montréal. Monthly sales have steadily fallen in each of the four cities, interrupted only by an August increase in Toronto. Monthly transactions now significantly trail their 10-year average in all but Calgary.
- September saw listings decline in Calgary, Toronto, and Montréal, although they were up 2.5 per cent in Vancouver. Toronto’s 8.2 per cent drop led the downturns. Montréal’s dip was 5.6 per cent, while Calgary’s was 3.1 per cent. These drops somewhat offset sales declines, allowing all four cities to post balanced market conditions.
- The average resale price rose 2.0 per cent in Vancouver and 1.6 per cent in Calgary. Toronto’s value was down 2.3 per cent, and Montréal’s was down 1.3 per cent. Still, prices remain above year-earlier levels everywhere but Toronto, which suffered a 3.9 per cent drop. Prices were up 5.2 per cent in Vancouver, 5.7 per cent in Calgary, and 3.0 per cent in Montréal.
Recent Market Performance
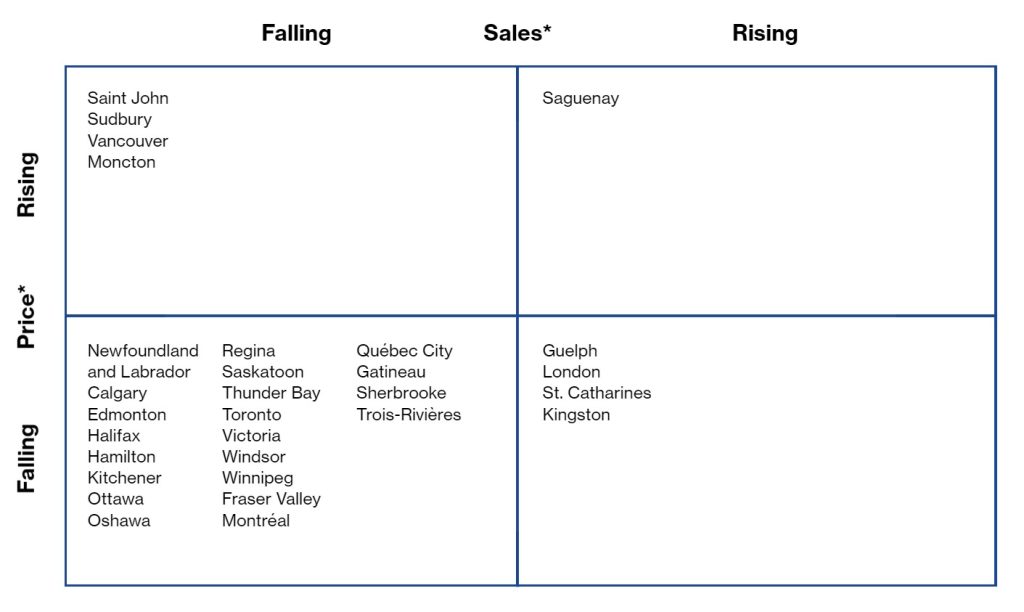
*Average month-to-month change during latest three months
Forecast of Near-Term Price Growth
(year-over-year)
+7%
Sudbury, Sherbrooke, Trois-Rivières, Saguenay, Saint John, Moncton
5–6.9%
None
3–4.9%
Victoria, Vancouver, Calgary, Saskatoon, Winnipeg, Thunder Bay, Gatineau, Montréal, Québec City, Halifax, Newfoundland and Labrador
0–2.9%
Edmonton, Hamilton, St. Catharines, Kitchene,r Guelph, London, Windsor, Kingston, Ottawa
Falling
Fraser Valley, Regina, Toronto, Oshawa

National existing home sales continued to drop in September, with the 3.9 per cent decline representing the seventh straight monthly drop.
Resale Indicators for September 2022
| Sales–to–new–listings ratio | ||||||||
| Market1 | Market classification | Sales (#)2 | Listings (#) | Level | Balanced market range3 |
Price ($) | ||
| 4,860 | 12,312 | 986,535 | ||||||
| Victoria | Buyers’ | –5.6 | 10.2 | 0.404 | 0.486–0.773 | –1.4 | ||
| –46.0 | 18.9 | 9.2 | ||||||
| 21,456 | 49,344 | 1,255,816 | ||||||
| Vancouver | balanced | –4.6 | 2.5 | 0.446 | 0.439–0.718 | 2.0 | ||
| –47.0 | –17.9 | 5.2 | ||||||
| 11,016 | 26,100 | 990,459 | ||||||
| Fraser Valley (4) | Buyers’ | –3.8 | 6.0 | 0.409 | 0.441–0.718 | –2.5 | ||
| –52.0 | –2.9 | –4.9 | ||||||
| 31,152 | 42,972 | 518,747 | ||||||
| Calgary | Balanced | –4.1 | –3.1 | 0.719 | 0.467–0.738 | 1.6 | ||
| –13.7 | –6.0 | 5.7 | ||||||
| 22,188 | 43,296 | 387,752 | ||||||
| Edmonton | Balanced | –1.8 | 1.4 | 0.530 | 0.452–0.728 | 0.5 | ||
| –14.5 | 1.1 | 0.3 | ||||||
| 4,308 | 6,480 | 300,607 | ||||||
| Regina | Balanced | –1.1 | 6.3 | 0.639 | 0.493–0.751 | –3.2 | ||
| 5.9 | –5.3 | –8.6 | ||||||
| 5,700 | 9,744 | 359,452 | ||||||
| Saskatoon | Balanced | –13.5 | –0.5 | 0.593 | 0.428–0.681 | –0.4 | ||
| –17.0 | –7.3 | 7.8 | ||||||
| 12,348 | 19,776 | 368,450 | ||||||
| Winnipeg | Balanced | –6.7 | 0.1 | 0.610 | 0.453–0.795 | 0.0 | ||
| –23.0 | 3.6 | 5.8 | ||||||
| 2,052 | 3,204 | 322,154 | ||||||
| Thunder Bay | Balanced | –3.4 | –5.3 | 0.662 | 0.502–0.767 | –0.8 | ||
| –8.1 | 11.7 | 7.6 | ||||||
| 2,652 | 3,732 | 456,945 | ||||||
| Sudbury | Sellers’ | 7.8 | –2.2 | 0.702 | 0.348–0.676 | 1.2 | ||
| –15.6 | –1.0 | 9.5 | ||||||
| 62,976 | 136,500 | 1,099,668 | ||||||
| Toronto | Balanced | –9.7 | –8.2 | 0.472 | 0.465–0.691 | –2.3 | ||
| –44.4 | –14.0 | –3.9 | ||||||
| 7,716 | 14,088 | 923,382 | ||||||
| Oshawa | Balanced | –11.7 | –11.4 | 0.532 | 0.480–0.754 | –1.2 | ||
| –36.4 | –6.5 | –5.9 | ||||||
| 8,988 | 20,280 | 872,521 | ||||||
| Hamilton | Buyers’ | –3.9 | –1.4 | 0.425 | 0.437–0.801 | –1.7 | ||
| –38.2 | 16.8 | –3.3 | ||||||
| 2,220 | 5,448 | 747,836 | ||||||
| St. Catharines | Balanced | –2.1 | –6.6 | 0.406 | 0.397–0.722 | 1.1 | ||
| –47.0 | 2.7 | –1.5 | ||||||
| 6,792 | 11,928 | 786,413 | ||||||
| Kitchener | Balanced | –9.3 | –15.8 | 0.541 | 0.485–0.770 | 0.4 | ||
| –25.8 | 1.8 | –2.8 | ||||||
| 2,364 | 4,500 | 873,842 | ||||||
| Guelph | Buyers’ | 15.9 | –4.8 | 0.490 | 0.507–0.838 | –0.2 | ||
| –29.4 | 24.2 | 3.0 | ||||||
| 6,708 | 15,420 | 661,629 | ||||||
| London | Balanced | –4.0 | 7.6 | 0.428 | 0.418–0.718 | –1.9 | ||
| –41.3 | 15.6 | 0.1 | ||||||
| 5,184 | 10,908 | 560,587 | ||||||
| Windsor | Balanced | 10.8 | –7.7 | 0.475 | 0.439–0.689 | 4.1 | ||
| –35.5 | –7.9 | –0.6 | ||||||
| 2,940 | 6,336 | 620,832 | ||||||
| Kingston | Balanced | 7.5 | 3.5 | 0.473 | 0.362–0.673 | 1.1 | ||
| –20.7 | 14.0 | 3.2 | ||||||
| 12,924 | 26,988 | 664,541 | ||||||
| Ottawa | Balanced | 0.7 | 3.4 | 0.485 | 0.417–0.717 | –0.1 | ||
| –33.3 | 2.1 | 0.8 | ||||||
| 3,990 | 6,738 | 452,826 | ||||||
| Gatineau | Balanced | –15.7 | 0.5 | 0.596 | 0.448–0.759 | 1.1 | ||
| –31.8 | 5.3 | 8.7 | ||||||
| 35,118 | 64,960 | 556,094 | ||||||
| Montréal | Balanced | –10.3 | –5.6 | 0.536 | 0.482–0.733 | –1.3 | ||
| –29.9 | 7.5 | 3.0 | ||||||
| 8,153 | 11,512 | 343,897 | ||||||
| Québec City | Balanced | –1.4 | 2.7 | 0.695 | 0.502–0.788 | –1.6 | ||
| –16.0 | 6.4 | 3.6 | ||||||
| 2,059 | 2,576 | 398,702 | ||||||
| Sherbrooke | Balanced | 3.2 | –5.4 | 0.741 | 0.452–0.783 | –8.7 | ||
| –7.8 | 12.3 | 11.7 | ||||||
| 1,505 | 2,076 | 295,648 | ||||||
| Trois–Rivières | Balanced | –2.3 | 11.9 | 0.722 | 0.480–0.821 | –6.4 | ||
| –1.8 | 30.6 | 13.4 | ||||||
| 1,370 | 1,603 | 257,251 | ||||||
| Saguenay | Sellers’ | 15.9 | –6.1 | 0.859 | 0.431–0.766 | 3.0 | ||
| –4.5 | –2.9 | 16.1 | ||||||
| 2,220 | 3,252 | 296,809 | ||||||
| Saint John | Sellers’ | 6.3 | –2.2 | 0.736 | 0.356–0.665 | 5.0 | ||
| –22.9 | –6.9 | 8.6 | ||||||
| 3,084 | 5,028 | 329,080 | ||||||
| Moncton | Balanced | –7.2 | 7.2 | 0.624 | 0.384–0.687 | 2.4 | ||
| –34.8 | 1.0 | 12.7 | ||||||
| 4,776 | 7,548 | 515,495 | ||||||
| Halifax | Balanced | –4.6 | 3.3 | 0.688 | 0.446–0.862 | 4.9 | ||
| –31.5 | –11.7 | 6.4 | ||||||
| 5,604 | 9,096 | 291,211 | ||||||
| Newfoundland and Labrador | Sellers’ | –3.5 | 0.4 | 0.621 | 0.346–0.595 | –1.0 | ||
| (province) | –24.4 | –6.5 | 5.9 | |||||
About the Metro Resale Snapshot
The monthly Metro Resale Snapshot provides an overview of the existing home market for 30 areas and expectations for existing home price growth over the short term.
Disclaimer: Forecasts and research often involve numerous assumptions and data sources and are subject to inherent risks and uncertainties.
This information is not intended as specific investment, accounting, legal, or tax advice. Visit signal49.ca for our latest insights.
Signal49 Research reserves the right to adjust content as necessary.