

The Resale Market May Be Approaching a Trough
Metropolitan Resale Snapshot
Key Findings
- Although August’s 1 per cent dip in national existing home sales was the sixth straight monthly drop, it was the smallest of these drops and may indicate that sales are bottoming out.
- Listings fell 5 per cent in August, putting listings roughly equal to their year-ago volume.
- Sales and listings trends were mixed. Transactions dropped in 18 of our 30 markets in August—including 11 areas where the monthly decline exceeded 5 per cent—but were up in 12 areas.
- Sales rose 11 per cent in Toronto during August, breaking a streak of five monthly declines. Transactions continued to dip in Vancouver, Calgary, and Montréal in August, but all declines were in single digits.
- For the second straight month, listings eased in all four cities. Montréal’s 7 per cent drop was the largest.
- Toronto’s average resale price increase of 2.1 per cent was its first increase in six months.
Recent Market Performance
*Average month-to-month change during latest three months
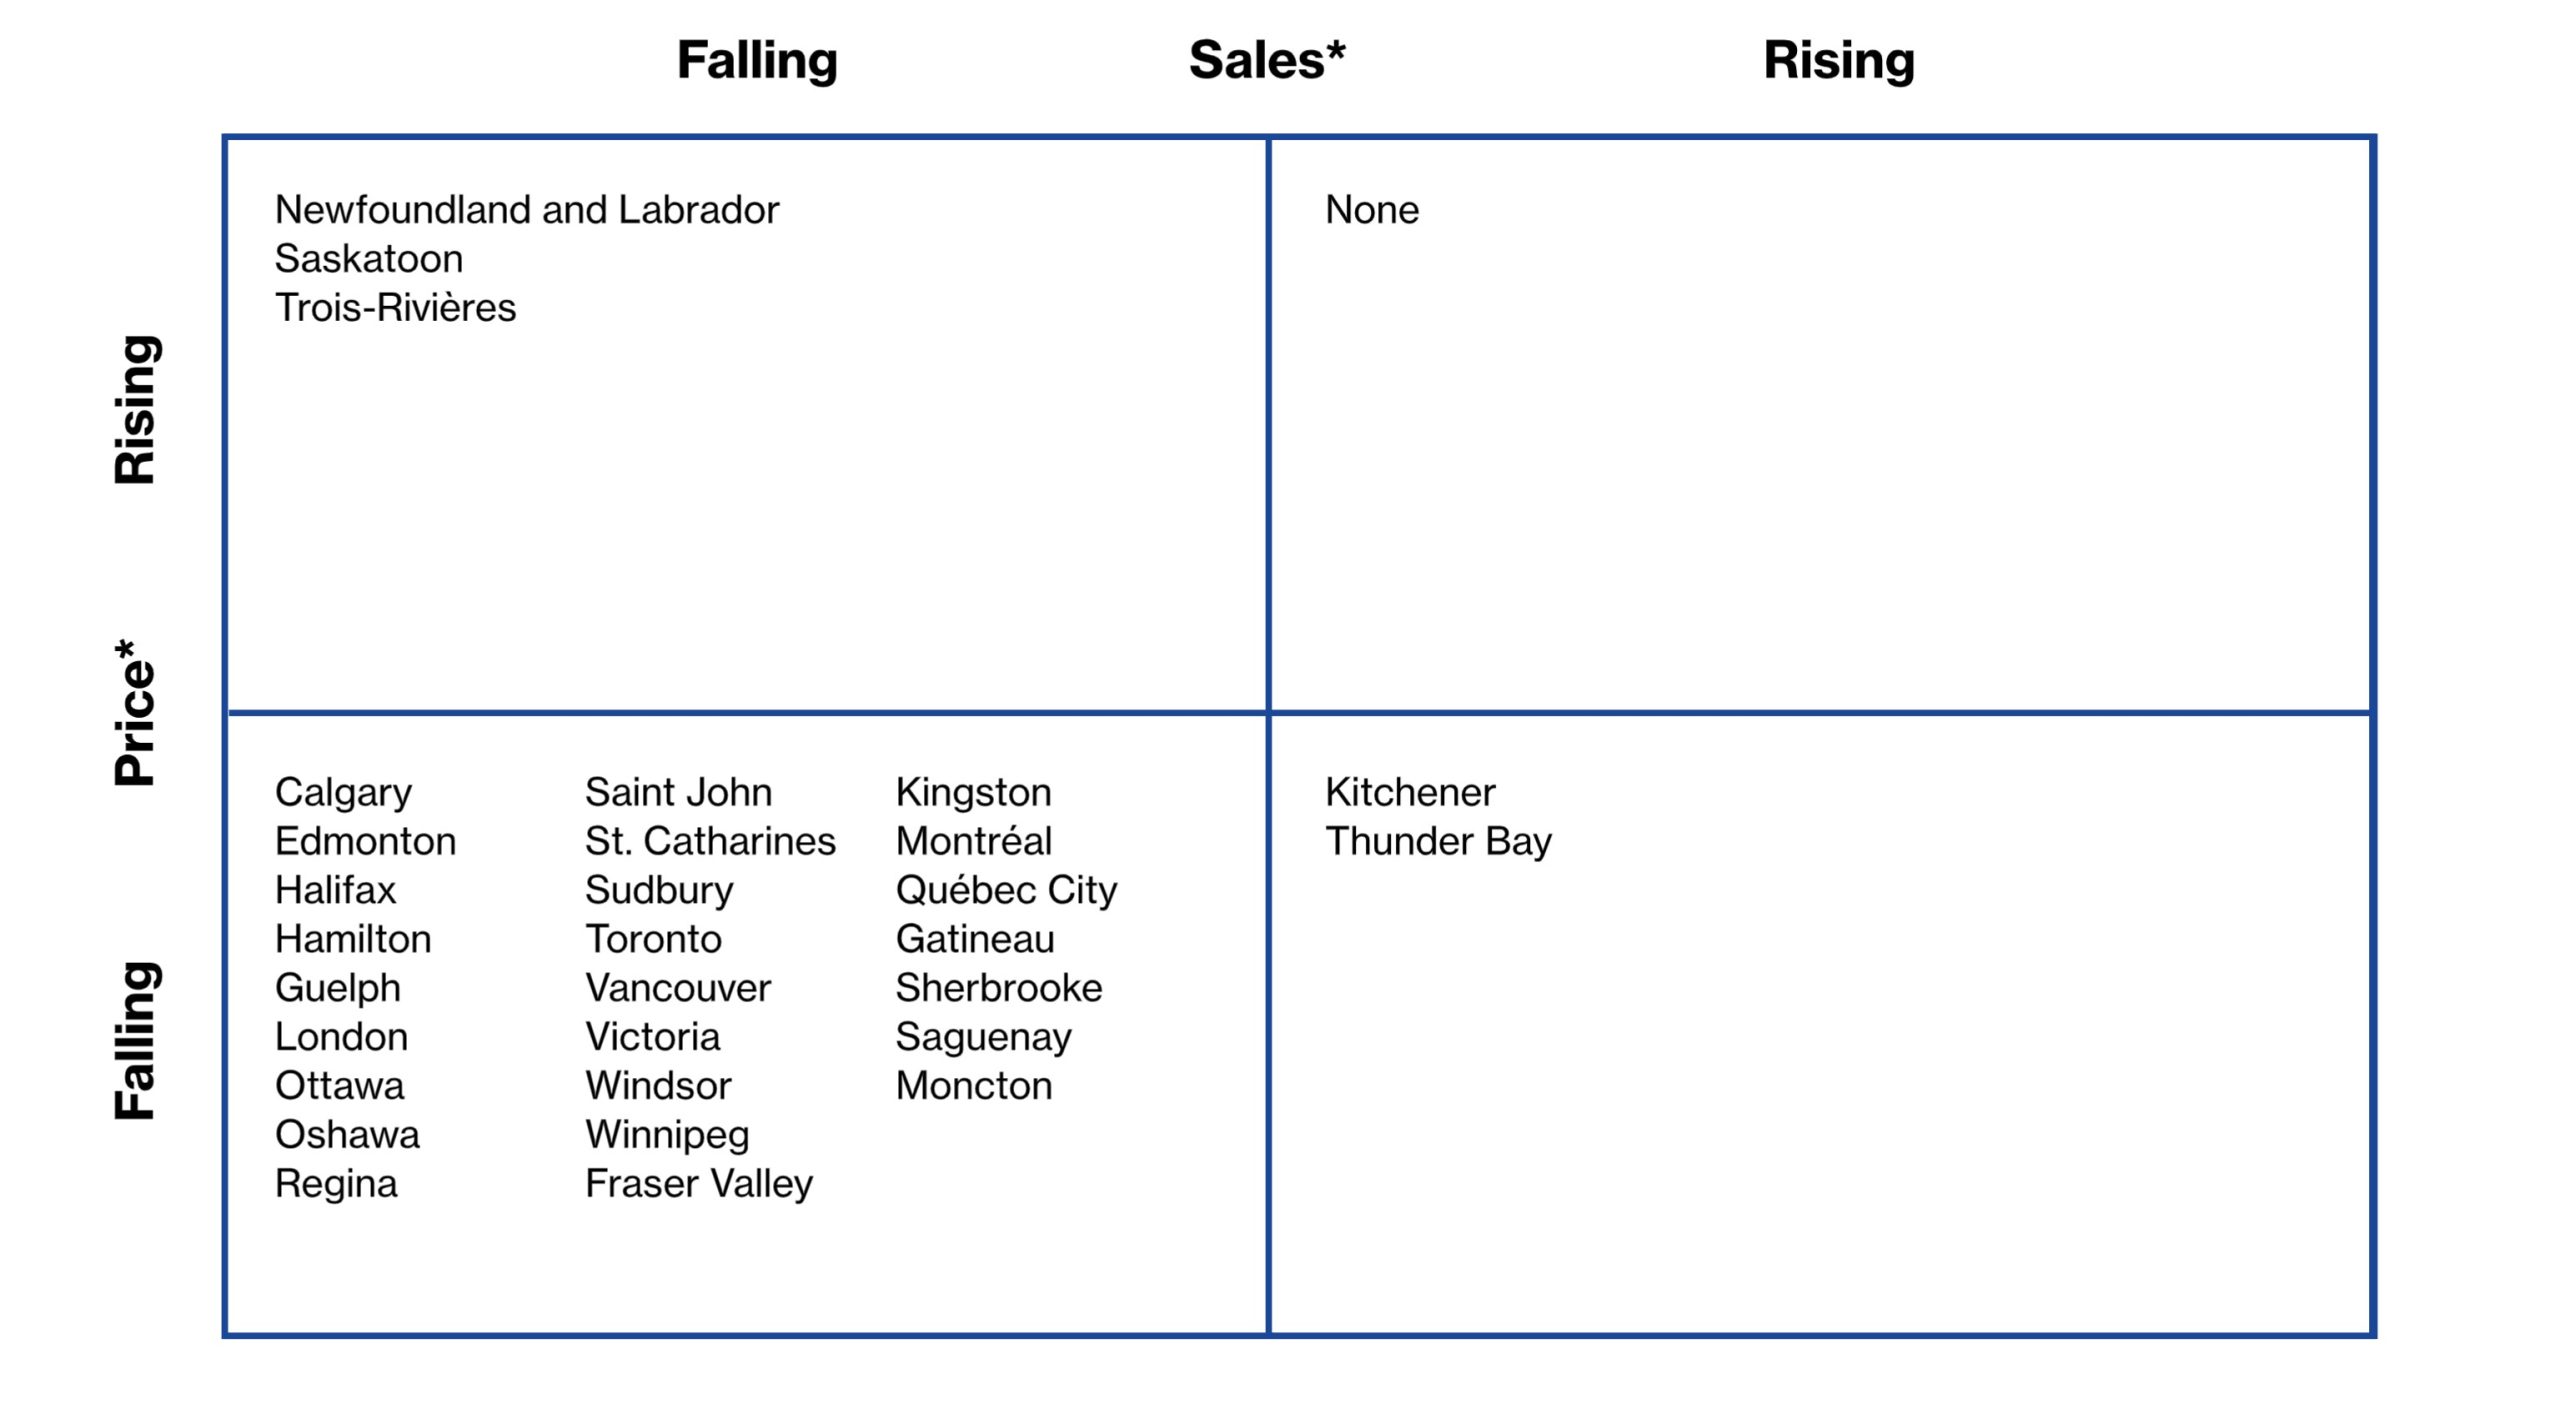
Forecast of Near-Term Price Growth
(year-over-year)
+7%
Sherbrooke, Trois-Rivières, Saguenay, Saint John, Moncton
5–6.9%
Victoria, Sudbury, London, Gatineau, Québec City, Halifax, Newfoundland and Labrador
3–4.9%
Vancouver, Calgary, Winnipeg, Thunder Bay, Hamilton, St. Catharines, Ottawa, Montréal
0–2.9%
Fraser Valley, Edmonton, Saskatoon, Toronto, Oshawa, Kitchener, Guelph, Windsor, Kingston
Falling
Regina
August’s 1 per cent dip in national existing home sales was the smallest of six-straight monthly drops, and may indicate that sales are bottoming out.
Resale Indicators for August 2022
| Sales-to-new-listings ratio | ||||||||
| Market1 | Market classification | Sales (#)2 | Listings (#) | Level | Balanced market range3 |
Price ($) | ||
| 5,196 | 11,148 | 1,005,536 | ||||||
| Victoria | Buyers’ | –8.8 | –5.0 | 0.465 | 0.486–0.773 | 4.7 | ||
| –43.2 | 5.4 | 12.1 | ||||||
| 22,788 | 48,228 | 1,227,216 | ||||||
| Vancouver | Balanced | –5.7 | –5.3 | 0.497 | 0.439–0.718 | –0.9 | ||
| –43.6 | –20.7 | 2.6 | ||||||
| 11,772 | 24,756 | 1,020,894 | ||||||
| Fraser Valley (4) | Balanced | –3.7 | –6.9 | 0.469 | 0.441–0.718 | –0.9 | ||
| –53.6 | –12.6 | 0.1 | ||||||
| 32,556 | 44,652 | 508,950 | ||||||
| Calgary | Sellers’ | –2.4 | –5.1 | 0.744 | 0.466–0.737 | –1.0 | ||
| –6.8 | –4.1 | 3.2 | ||||||
| 22,692 | 42,660 | 385,190 | ||||||
| Edmonton | Balanced | –5.6 | –8.0 | 0.535 | 0.452–0.729 | –3.7 | ||
| –13.4 | 0.5 | –1.4 | ||||||
| 4,380 | 5,952 | 310,656 | ||||||
| Regina | Balanced | –0.5 | –15.1 | 0.692 | 0.492–0.751 | –8.1 | ||
| 7.0 | –11.0 | –6.9 | ||||||
| 6,636 | 9,900 | 361,444 | ||||||
| Saskatoon | Balanced | 2.0 | –7.1 | 0.658 | 0.428–0.681 | 0.7 | ||
| –9.6 | –14.2 | 4.7 | ||||||
| 13,272 | 19,836 | 366,606 | ||||||
| Winnipeg | Balanced | –10.4 | –8.7 | 0.643 | 0.453–0.795 | –0.7 | ||
| –14.7 | 0.4 | 4.3 | ||||||
| 2,196 | 3,360 | 324,889 | ||||||
| Thunder Bay | Balanced | –1.6 | –0.7 | 0.640 | 0.501–0.767 | 0.6 | ||
| –5.7 | 17.6 | 3.3 | ||||||
| 2,520 | 3,792 | 451,629 | ||||||
| Sudbury | Balanced | –11.4 | –12.0 | 0.664 | 0.348–0.675 | 1.8 | ||
| –15.3 | 0.3 | 13.6 | ||||||
| 70,620 | 148,404 | 1,130,463 | ||||||
| Toronto | Balanced | 11.1 | –2.8 | 0.492 | 0.465–0.691 | 2.1 | ||
| –37.5 | –2.3 | 1.1 | ||||||
| 8,964 | 16,140 | 939,591 | ||||||
| Oshawa | Balanced | 8.9 | –5.2 | 0.570 | 0.480–0.755 | 2.3 | ||
| –26.3 | 5.7 | 1.0 | ||||||
| 9,720 | 20,520 | 889,122 | ||||||
| Hamilton | Balanced | 2.0 | –0.8 | 0.483 | 0.437–0.801 | –0.2 | ||
| –30.4 | 16.6 | 2.7 | ||||||
| 2,328 | 5,832 | 732,276 | ||||||
| St. Catharines | Buyers’ | 12.1 | –2.0 | 0.396 | 0.397–0.722 | –5.4 | ||
| –38.4 | 28.9 | 1.5 | ||||||
| 7,776 | 14,160 | 781,363 | ||||||
| Kitchener | Balanced | 20.0 | –5.3 | 0.575 | 0.485–0.770 | 1.5 | ||
| –16.8 | 18.8 | –0.8 | ||||||
| 2,124 | 4,788 | 874,840 | ||||||
| Guelph | Buyers’ | –6.8 | –8.7 | 0.446 | 0.507–0.839 | –2.2 | ||
| –38.1 | 12.7 | 3.7 | ||||||
| 7,344 | 14,220 | 682,843 | ||||||
| London | Balanced | 11.3 | –8.9 | 0.499 | 0.419–0.718 | –0.3 | ||
| –37.6 | 4.6 | 7.0 | ||||||
| 4,776 | 11,616 | 539,241 | ||||||
| Windsor | Buyers’ | –6.6 | –16.8 | 0.402 | 0.439–0.689 | –5.1 | ||
| –38.4 | 10.0 | –4.7 | ||||||
| 2,808 | 6,084 | 611,577 | ||||||
| Kingston | Balanced | –2.9 | –2.7 | 0.463 | 0.362–0.673 | –4.3 | ||
| –24.5 | 21.6 | 3.0 | ||||||
| 13,296 | 25,824 | 669,141 | ||||||
| Ottawa | Balanced | 0.5 | –1.7 | 0.522 | 0.417–0.718 | 0.4 | ||
| –30.6 | –2.5 | 5.1 | ||||||
| 4,773 | 6,760 | 446,373 | ||||||
| Gatineau | Balanced | 4.9 | –8.7 | 0.741 | 0.448–0.759 | –0.5 | ||
| –8.3 | 2.4 | 9.4 | ||||||
| 39,986 | 69,483 | 565,349 | ||||||
| Montréal | Balanced | –7.5 | –6.8 | 0.571 | 0.482–0.734 | –1.6 | ||
| –18.7 | 17.8 | 4.5 | ||||||
| 8,254 | 11,232 | 350,068 | ||||||
| Québec City | Balanced | 4.1 | –10.5 | 0.729 | 0.502–0.788 | –2.2 | ||
| –10.7 | 7.3 | 5.4 | ||||||
| 1,992 | 2,771 | 439,278 | ||||||
| Sherbrooke | Balanced | 2.9 | –9.1 | 0.698 | 0.451–0.782 | 0.5 | ||
| –13.2 | 34.6 | 15.4 | ||||||
| 1,548 | 1,860 | 318,618 | ||||||
| Trois-Rivières | Sellers’ | 2.8 | –13.2 | 0.850 | 0.479–0.821 | 4.3 | ||
| 6.9 | 2.1 | 32.0 | ||||||
| 1,158 | 1,711 | 250,045 | ||||||
| Saguenay | Balanced | –4.0 | 10.6 | 0.695 | 0.430–0.764 | –0.7 | ||
| 2.2 | 5.1 | 16.6 | ||||||
| 2,124 | 3,336 | 280,492 | ||||||
| Saint John | Sellers’ | –12.4 | 3.0 | 0.736 | 0.355–0.664 | 1.2 | ||
| –22.7 | –7.3 | 15.9 | ||||||
| 3,360 | 4,680 | 319,447 | ||||||
| Moncton | Sellers’ | –8.2 | –10.1 | 0.746 | 0.384–0.686 | –1.5 | ||
| –28 | –12.0 | 13.6 | ||||||
| 5,028 | 7,416 | 490,662 | ||||||
| Halifax | Balanced | –12.9 | –3.6 | 0.745 | 0.445–0.863 | –6.0 | ||
| –31.3 | –17.4 | 7.8 | ||||||
| 5,904 | 8,988 | 294,692 | ||||||
| Newfoundland and Labrador | Sellers’ | –3.7 | –2.5 | 0.683 | 0.346–0.595 | –0.8 | ||
| (province) | –8.4 | –22.0 | 8.2 | |||||
About the Metro Resale Snapshot
The monthly Metro Resale Snapshot provides an overview of the existing home market for 30 areas and expectations for existing home price growth over the short term.
Disclaimer: Forecasts and research often involve numerous assumptions and data sources and are subject to inherent risks and uncertainties.
This information is not intended as specific investment, accounting, legal, or tax advice. Visit signal49.ca for our latest insights.
Signal49 Research reserves the right to adjust content as necessary.