


Measuring Immigration’s Impact on Municipalities
The Absorptive Capacity Index
October 26, 2026
Canadian municipalities differ in their capacity to successfully integrate immigrant populations. Identical levels of immigration can generate positive outcomes in some places and negative outcomes in others.
When immigration levels exceed a municipality’s current capacity, essential services for everyone who lives there come under pressure. On the other hand, too few immigrants to a municipality may lead to population decline, labour shortages, and underutilized infrastructure.1
We developed the Absorptive Capacity Index (ACI) to measure how immigration is associated with changes in economic conditions, housing affordability, access to health facilities, education systems, and public transit. The tool provides an assessment of a municipality’s ability to effectively integrate new Canadians. Download our methodology for more about how we developed the index.

Absorptive capacity
Definitions of absorptive capacity vary, but we use the term to refer to a municipality’s ability to integrate population growth over a short time frame without compromising overall living standards or straining access to services such as housing, healthcare, and social supports.2 When infrastructure and services are unable to support population growth, we refer to this as “strained capacity”.
When infrastructure and services can handle and absorb population growth, we speak of “balanced capacity” or “under capacity”.
The ACI is a diagnostic tool, not a recommendation about how much immigration a municipality should receive. Municipalities have different population goals, and they may not all seek to increase immigration or expand their absorptive capacity. An under-capacity score indicates that immigration is associated with more manageable or favourable outcomes, but it does not mean that a municipality should necessarily pursue higher immigration. Similarly, a strained capacity score identifies areas of pressure that may require closer examination; it does not mean that immigration should stop. The results are intended to inform local decisions alongside municipal priorities, community perspectives, and other evidence.
- Guccini, How Canada Can Chart a Sustainable Path.
- Guccini.
Higher immigration does not always mean strained capacity

Municipalities with similar immigration rates can experience different outcomes. For example, the municipalities of Victoria and Langford in British Columbia both have an immigration rate of 4 per cent, but Victoria is under capacity, while nearby Langford has a strained capacity. The difference depends on underlying economic conditions, housing supply, service infrastructure, and transit systems.
There is no single threshold at which immigration-driven population growth strains the capacity of local systems.1 Pressures emerge differently across places depending on whether the provision of housing, job opportunities, access to public transit, and access to quality health and education services can keep pace with population growth.2
Municipalities with the highest immigration rates also show divergent results. In Ontario, Toronto is rated balanced capacity with an immigration rate of about 7 per cent, while Mississauga, Brampton, and Oakville are classified as strained capacity with similar rates of immigration.
These examples reinforce that immigration levels alone do not determine whether a municipality experiences strained capacity, balanced, or under capacity—what matters is how immigration aligns with local capacity.

Most municipalities have strained capacity
Sixty-four per cent of municipalities (n = 142) are rated strained capacity, with overall ACI scores below 50. These municipalities show signs that immigration is more often associated with pressure on local systems, suggesting that current capacity may be less able to accommodate rapid population growth. Examples of municipalities with this rating are Sault Ste. Marie (Ontario), Sherbrooke (Quebec), Langley (British Columbia), and Edmonton (Alberta).
This finding should not be interpreted as a national limit on immigration or as evidence that immigration is the sole cause of local pressures. The ACI identifies municipalities where immigration is associated with strain relative to the other municipalities studied. This pattern is consistent with prior research, which has highlighted housing, healthcare, and infrastructure pressures as signs that absorptive capacity can be compromised when population growth outpaces service expansion.3 Depending on local objectives, the appropriate response may include increasing capacity, better coordinating population and infrastructure planning, changing the distribution or pace of growth, or examining the issue in greater detail using local data.
At the same time, a good number of municipalities appear to have additional room to adapt. Thirty-three per cent of municipalities (n = 74) are under capacity—scoring greater than 50. Examples of municipalities with this rating are Delson (Quebec), East St. Paul (Manitoba), North Saanich (British Columbia), and Rothesay (New Brunswick). In these places, immigration is more often associated with manageable or favourable outcomes across the five dimensions, suggesting that the current infrastructure is better positioned to accommodate higher levels of immigration-driven growth.
Only a small share of municipalities falls in the middle of the distribution. Just 3 per cent of municipalities (n = 6) were rated balanced capacity—meaning that immigration appears broadly aligned with local capacity at current levels. These municipalities are not necessarily free of pressure, but they appear more closely calibrated to the scale of immigration-driven population growth they are currently experiencing. The municipalities with this rating are Surrey (British Columbia), Saint-Jérôme (Quebec), Drummondville (Quebec), Gatineau (Ottawa), Toronto (Ontario), and Abbotsford (British Columbia).
Immigration rates alone do not explain why some municipalities have strained capacity while others do not. The trendline in Chart 1 shows no meaningful relationship between municipalities’ immigration rate and ACI score. Municipalities with higher immigration rates are no more likely to have stronger or weaker capacity than municipalities with similar immigration rates. Many municipalities with similar immigration rates fall into different capacity categories, reinforcing that immigration levels are not a determinant of local capacity.
Chart 1
Immigration rates alone do not explain local capacity
(immigration rate, per cent, n = 222 municipalities)
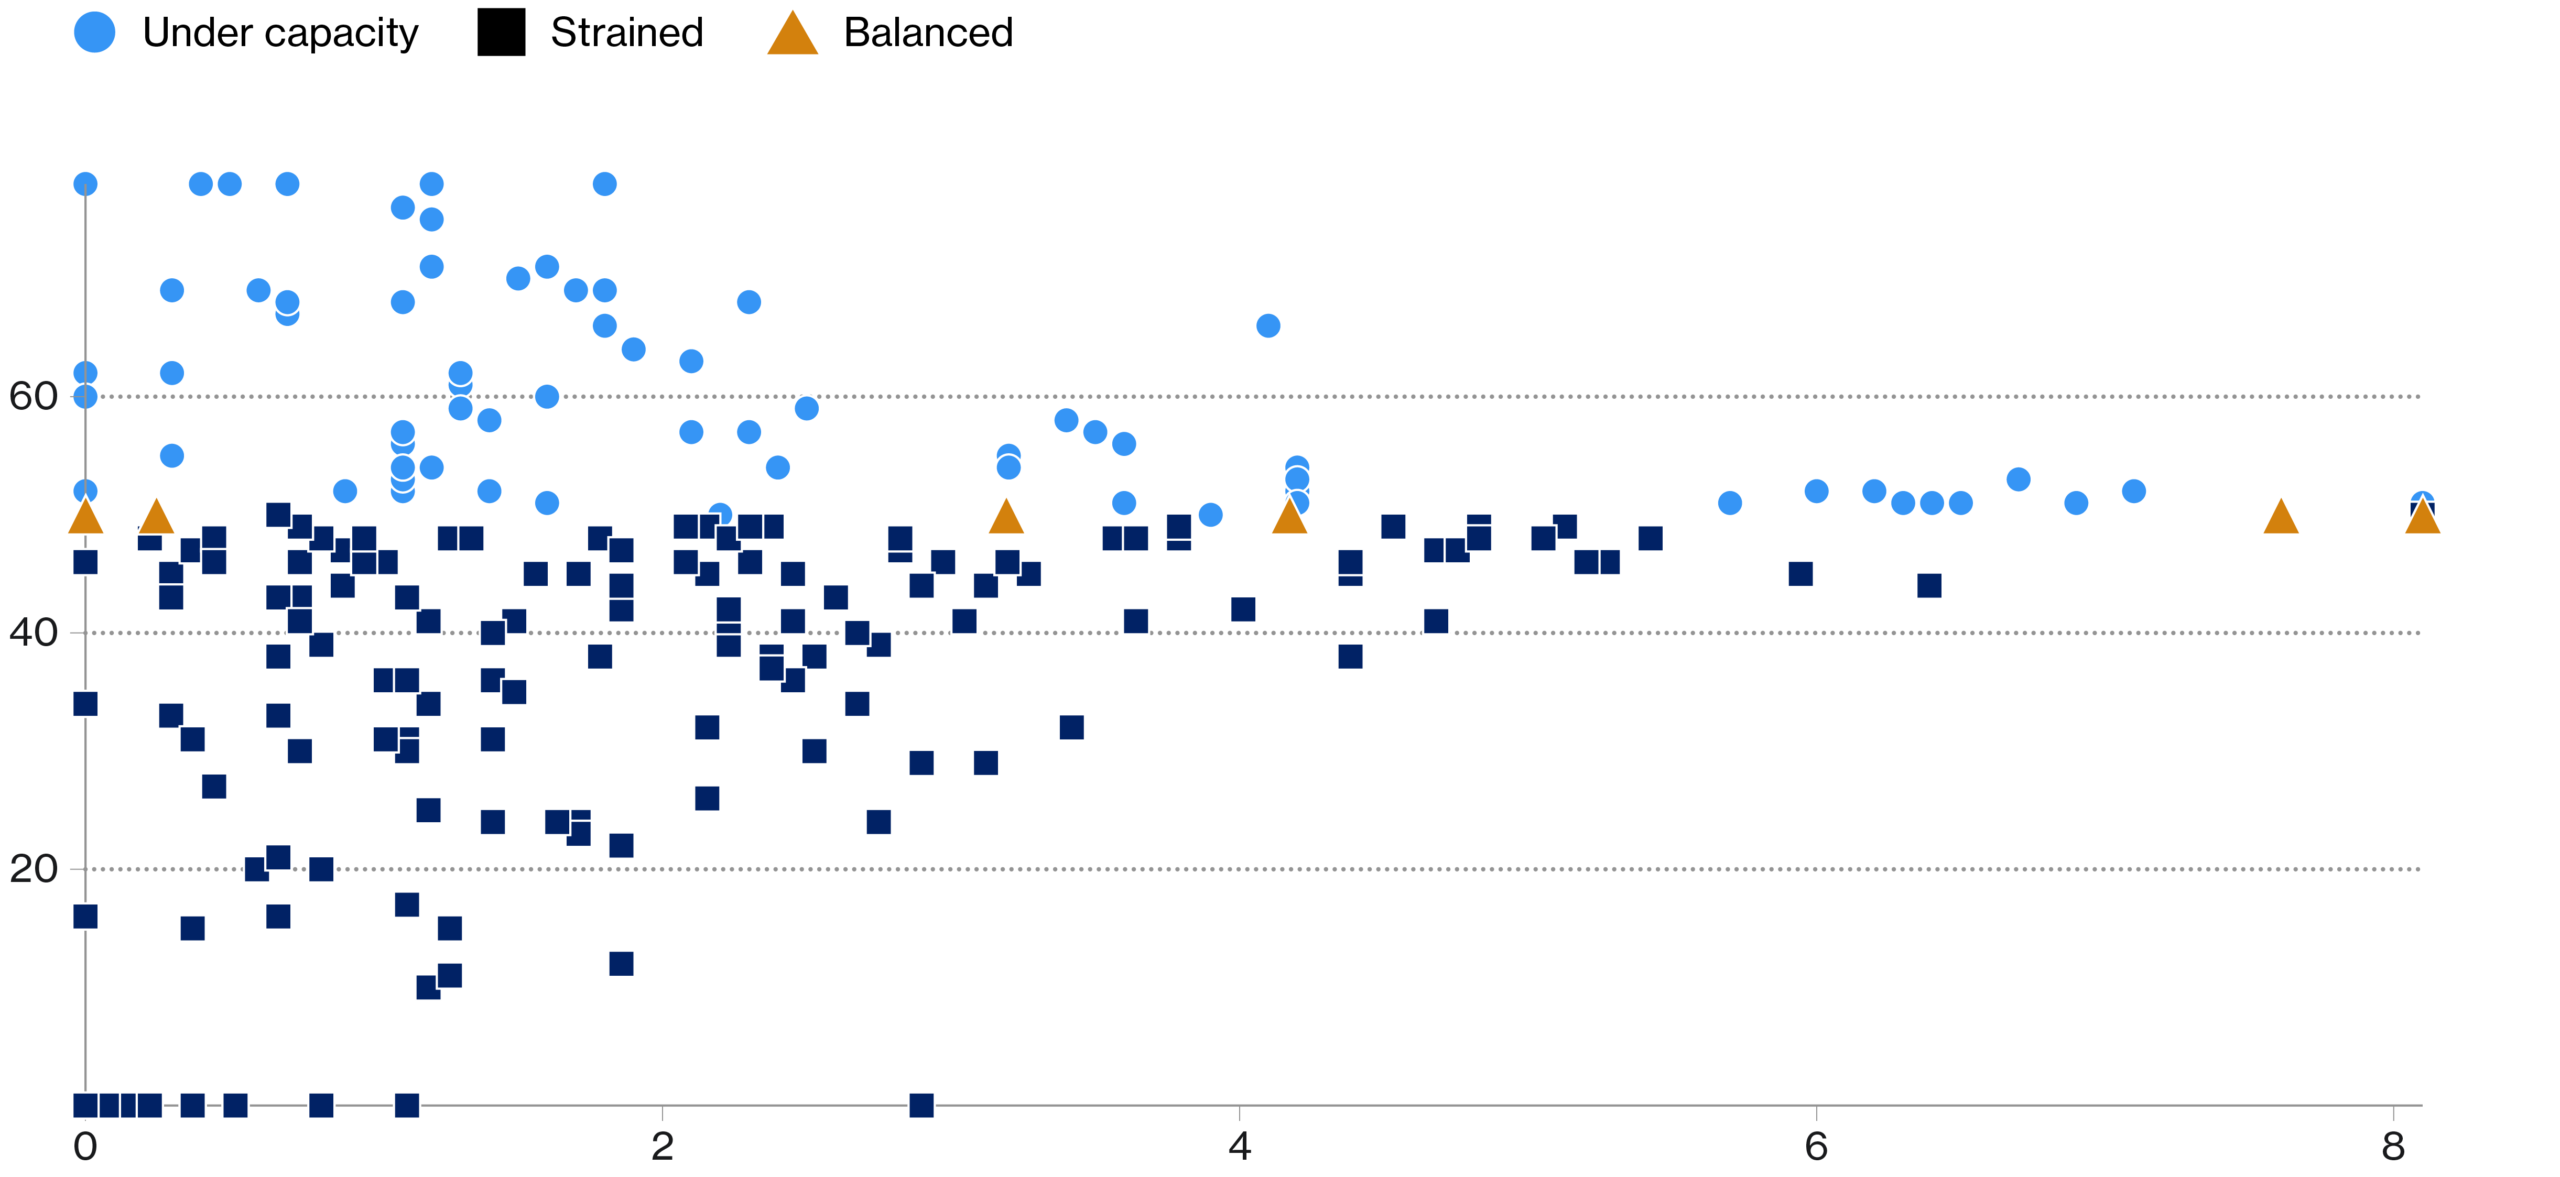
Source: Signal49 Research; Statistics Canada.

Capacity strain occurs even at very low immigration levels
In municipalities with strained capacity, even small inflows of immigrants can aggravate existing pressures, particularly where housing supply is limited or labour markets are weak.
This pattern explains why some municipalities struggle to accommodate even low immigration rates, while others remain more resilient. For example, King, Port Colborne, Pelham, and Wilmot in Ontario are all classified as strained despite immigration rates of under 1 per cent.
Other smaller municipalities remain resilient at similarly low levels of immigration: Saint‑Jérôme and Delson in Quebec are balanced and under capacity, respectively, also with immigration rates of just 1 per cent.
Municipality size affects capacity constraints
Municipality size
Municipality size is based on total population. Small municipalities have fewer than 30,000 residents. Medium-sized municipalities have between 30,000 and 99,999 residents. Large municipalities have 100,000 or more residents. These categories help compare how capacity constraints differ by municipal scale.

Larger municipalities tend to face fewer binding capacity constraints than smaller ones. Eight per cent of large municipalities (n = 4) have a balanced capacity rating, more than medium-sized (3 per cent, n = 2) and small-sized municipalities (0 per cent). Large municipalities tend to have broader labour market opportunities, more established immigrant networks (e.g., family, friends, and co‑ethnic communities), and a wider range of services and infrastructure that support integration. These features can make larger municipalities better able to adjust to immigration-driven population growth without tipping into strained capacity.
By contrast, small and medium‑sized municipalities typically operate closer to fixed capacity constraints, where small changes in population can stretch the municipality’s existing service infrastructure and create competition for the limited number of jobs and housing options. These municipalities may also have fewer social structures that new immigrants tend to rely on in their first few years in Canada, such as established immigrant communities, informal networks, and specialized settlement services.5
However, smaller-sized communities do not automatically imply strained capacity. We find substantial variation across municipalities that might otherwise be considered alike (see Chart 2) depending on the interaction between immigration levels and local conditions. Some smaller municipalities may have room to accommodate more immigration, while others may require targeted investment in affordable housing, primary care services, settlement and employment supports, and transportation.6
Chart 2
Larger municipalities have more balanced capacity, while smaller municipalities have more strained capacity
(share of municipalities, per cent)

Source: Statistics Canada; Signal49 Research.
- Elrick, “The problem with immigration targets.”
- Preston and others, The Municipal Role in Immigration.
- Hiebert, Understanding the Impact of Immigration on Demography; and Doyle and others, “The economics of Canadian immigration levels.”
- Blower, “Exploring Innovative Migrant Integration Practices in Small and Mid-Sized Cities across Canada”; Frenette, Economic Immigrants in Gateway Cities; and Esses and Carter, Beyond the Big City.
- Esses and Carter, Beyond the Big City; Blower, “Exploring Innovative Migrant Integration Practices in Small and Mid-sized Cities across Canada”; Kelly and Nguyen, “Choosing to Stay”; and Kelly and others, “Why Migrants Stay in Small and Mid-sized Cities.”
- Kelso, Safeguarding support for immigration; and Blower, “Exploring Innovative Migrant Integration Practices in Small and Mid-sized Cities across Canada.”
Uses for this tool
Target investments where municipalities show the greatest strain.
Municipal planners can use the ACI and its five-dimension scores to direct funding for service planning and infrastructure investments most likely to limit a municipality’s ability to absorb immigration-driven growth. Planners can seek out the low scores below 50 across the five dimensions, signaling the area where strained capacity is strongest to target investments. When several dimensions are low, the municipality may need a broader, cross-system response. These results should be considered alongside local service data, infrastructure plans, budgets, projected population growth, and consultation with service providers and residents before investment decisions are made.
Use regional strategies to target immigration to communities with greater absorptive capacity.
Provincial and federal governments can use the ACI as one source of evidence when considering the regional immigration, settlement service, and infrastructure needs with municipalities. An under-capacity or balanced rating may indicate that a municipality is comparatively well positioned to accommodate growth, but decisions about attracting and retaining newcomers should also reflect municipalities’ broader objectives. A strained capacity rating can help identify where additional support or investment may be needed, rather than serving as a reason to exclude a municipality from immigration or settlement initiatives.
Absorptive Capacity Index
Municipalities
For this study, we refer to Census Subdivisions (CSDs) as the administrative boundaries of a municipality. The municipalities can be villages, towns, and cities. In total, we provide data for 222 distinct municipalities across Canada:
• Alberta – 21 municipalities
• British Columbia – 40 municipalities
• Manitoba – 2 municipalities
• New Brunswick – 7 municipalities
• Newfoundland and Labrador – 3 municipalities
• Nova Scotia – 2 municipalities
• Ontario – 66 municipalities
• Quebec – 76 municipalities
• Saskatchewan – 5 municipalities
How to use the Absorptive Capacity Index
The ACI highlights which municipalities are under greater pressure than others and which may have more capacity to adapt.
The index aggregates the impacts of immigration-driven population growth across five dimensions of municipal capacity:
• the economy
• housing
• health and community well-being
• education
• public transit.
A higher score indicates greater capacity to absorb immigration while a lower score means that a municipality has less capacity to absorb immigration.
The index should be read as a summary of whether immigration is associated with more pressure or more capacity in a municipality across five dimensions. The underlying index is centred on 50: values between 0 and 49 indicate that immigration is more often associated with strained local conditions, values between 51 and 100 indicate that immigration is more often associated with favourable or manageable conditions, and values of 50 indicate a more balanced relationship.
The dimension scores work the same way, but each one focuses on a single area of capacity. A higher score on a dimension means immigration is associated with better or more manageable outcomes in that area, while a lower score means immigration is associated with more pressure or weaker outcomes in that area. For example, the economic score reflects labour market conditions such as unemployment, participation, and earnings; housing reflects affordability and rental pressure; health and community well-being reflects access to health facilities; education reflects school capacity; and transit reflects public transit use. Together, the five-dimension scores help explain why a municipality’s overall ACI score is higher or lower.
A score of 50 suggests a more balanced relationship between immigration and local conditions in that area. Scores below 50 indicate that immigration is more often associated with strain in that dimension, while scores above 50 indicate more manageable or favourable conditions. A score of 0 does not mean that a municipality has no hospital, school, or transit service, and a score of 100 does not mean that a problem is solved everywhere. Rather, these values show where municipalities fall relative to one another on the selected dimension. Because all dimension scores are placed on a common scale, they can be compared across municipalities and across dimensions.

Use the following eight steps to navigate the tool:
- Start with the map: Use the map to get a high-level view of municipalities across Canada and where scores are higher or lower. Darker blues represent higher scores than lighter blues. Grey areas in the map represent CSDs that were not included in this study either due to insufficient data, or it was not a population centre.
- Filter by province or municipality: Use the slicers at the top to narrow the view to a province or a specific municipality.
- Filter by capacity: Use the pie chart to slice the map and the table to municipalities with either strained, under capacity, or balanced capacity.
- Choose what you want to explore: Use the Dimension selector to switch between the overall Absorptive Capacity Index and the five capacity areas: economic, housing, health and community well-being, education, and transit.
- Find your municipality in the table: Use the table on the right to locate a municipality and view its score for the selected measure.
- Interpret the score: On the displayed 0 to 100 scale, scores of 50 suggest a balanced relationship between immigration and local capacity. Scores below 50 suggest more strain, while scores above 50 suggest more capacity to accommodate immigration-driven growth.
- Compare across places and dimensions: Look at how your municipality compares with others and check whether pressures are concentrated in one dimension or spread across several.
- Use the results for planning: Use the findings to identify where immigration levels appear aligned with local capacity, where investments may be needed, and where there may be room to support more growth.
The Absorptive Capacity Index and scores for the five dimensions
Acknowledgements
This research was prepared with financial support from the National Immigration Centre. For more information see the Centre’s webpage.
Many colleagues helped to bring this research to life. Stein Monteiro, Lead Research Associate, PhD and Federica Guccini, Research Associate, PhD executed the research. Lauren Hamman, (former) Associate Director, MPPGA; Bethany Haalboom, Lead Research Associate, PhD and Stefan Fournier, Executive Director, MA, provided feedback. This output was designed by the Design Services team at Signal49 Research.
We also wish to thank the members of the Research Advisory Board who supported this research:
- Roukya Abdi Aden, Manager, National Consultations on Economic Development and Employability, RDÉE Canada (Réseau de développement économique et d’employabilité)
- John Calhoun, Assistant Director and Senior Economist, Post-Secondary Education, Training and Labour, Government of New Brunswick
- Victoria Esses, Professor of Psychology, Western University, Principal Investigator of the Pathways to Prosperity Partnership
- Ashraf Mirmontahai, Director, Employment Services Unit, Saskatoon Open Door Society
- Alex Taylor, Manager, Post-Secondary Education, Training and Labour, Government of New Brunswick
- Jeslyn Thibedeau, Assistant Director of the Outcomes Analysis Unit, Immigration, Refugees and Citizenship Canada
Canada’s future prosperity depends on immigration. Optimizing our systems for attracting, selecting, and settling immigrants will maximize the benefits for both newcomers and Canadians. The National Immigration Centre (NIC) was established to strengthen Canada’s immigration system through independent, impartial, evidence-based research.
The NIC brings together senior leaders from diverse sectors, including government, legal and consultancy firms, regulatory bodies, service providers, and research organizations. NIC members help shape the research agenda and collaborate to drive meaningful improvements in Canada’s immigration system.
The NIC is the only national research initiative of its kind, convening discussions and producing publications that address critical knowledge gaps affecting system-level decision-making and policy development. Its research focuses on critical elements of immigration, including selection, settlement services, and francophone immigration. The NIC draws on case studies, best practices, and robust cross-sectoral data to generate impactful, evidence-based findings that will inform the future of Canada’s immigration system.
Our research centre model creates collective impact, amplifying its reach and producing actionable insights. Our immigration research has influenced national policy development and community action. It is shaping media narratives and driving measurable changes in government strategy. These contributions demonstrate our pivotal role in advancing immigration policy through evidence-based insights and national thought leadership.
To become a member of the NIC, visit us.
Funding members